


Similar Questions
Explore conceptually related problems
Recommended Questions
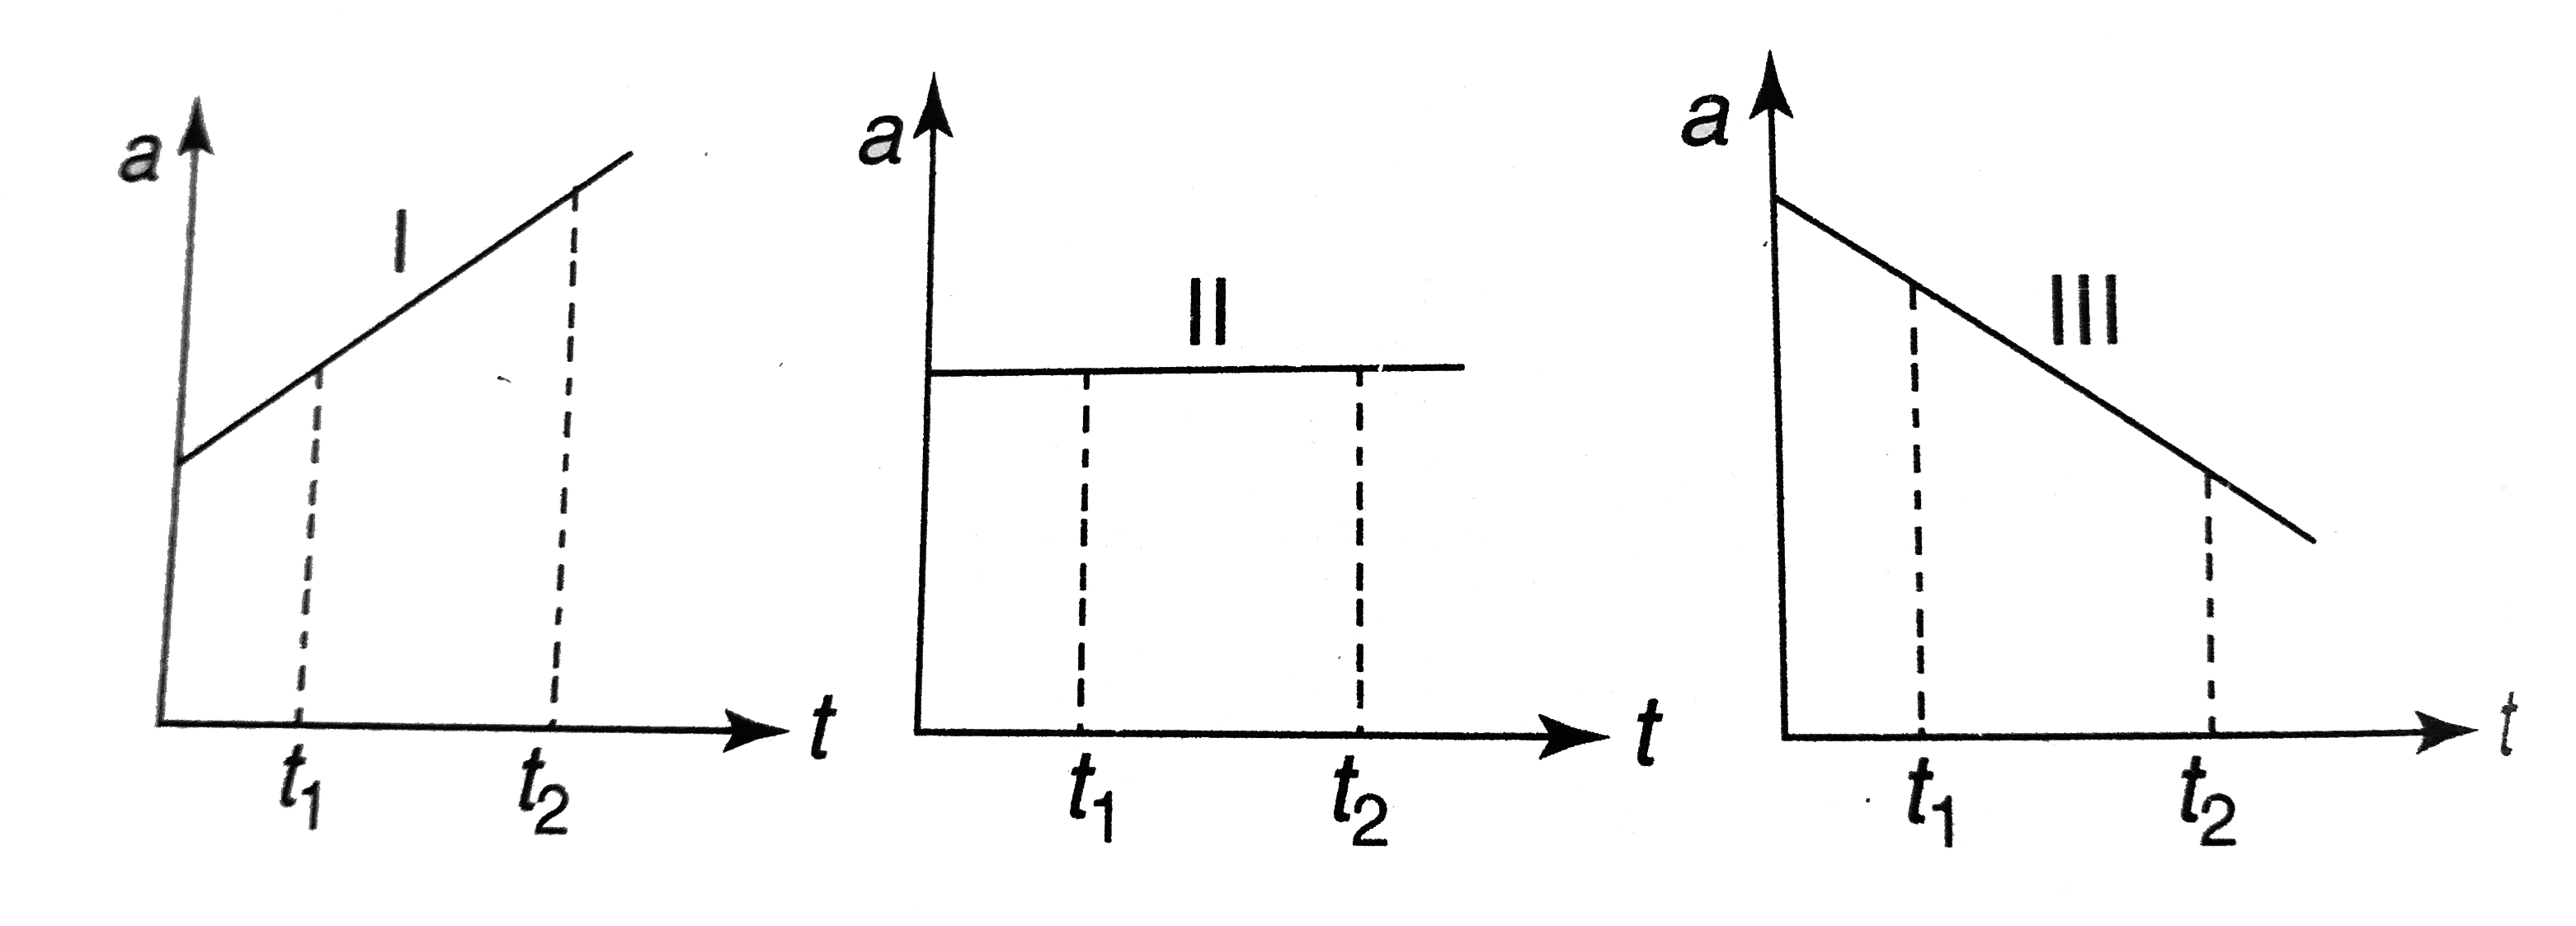
- Each of the three graphs represents acceleration versus time for an ob...
Text Solution
|
- Figure shows the displacement-time graph of a particle moving in a str...
Text Solution
|
- Each of the three graphs represents acceleration versus time for an ob...
Text Solution
|
- दिखाइए की किसी निश्चित समय अन्तराल में समय-त्वरण ग्राफ तथा समय-अक्ष क...
Text Solution
|
- सिद्ध कीजिए कि एकसमान त्वरित गति में वेग - समय ग्राफ तथा समय अक्ष के ब...
Text Solution
|
- The graph in figure shows the velocity v versus time t for a body. Whi...
Text Solution
|
- चित्र में किसी वस्तु के लिए त्वरण-समय ग्राफ प्रदर्शित किया गया है। इसी...
Text Solution
|
- कण की गति के लिये वेग तथा समय के मध्य बनाये गये ग्राफ में वक्र तथा समय...
Text Solution
|
- Draw the position-time graph for an object in uniform motion. Show tha...
Text Solution
|