


Similar Questions
Explore conceptually related problems
Recommended Questions
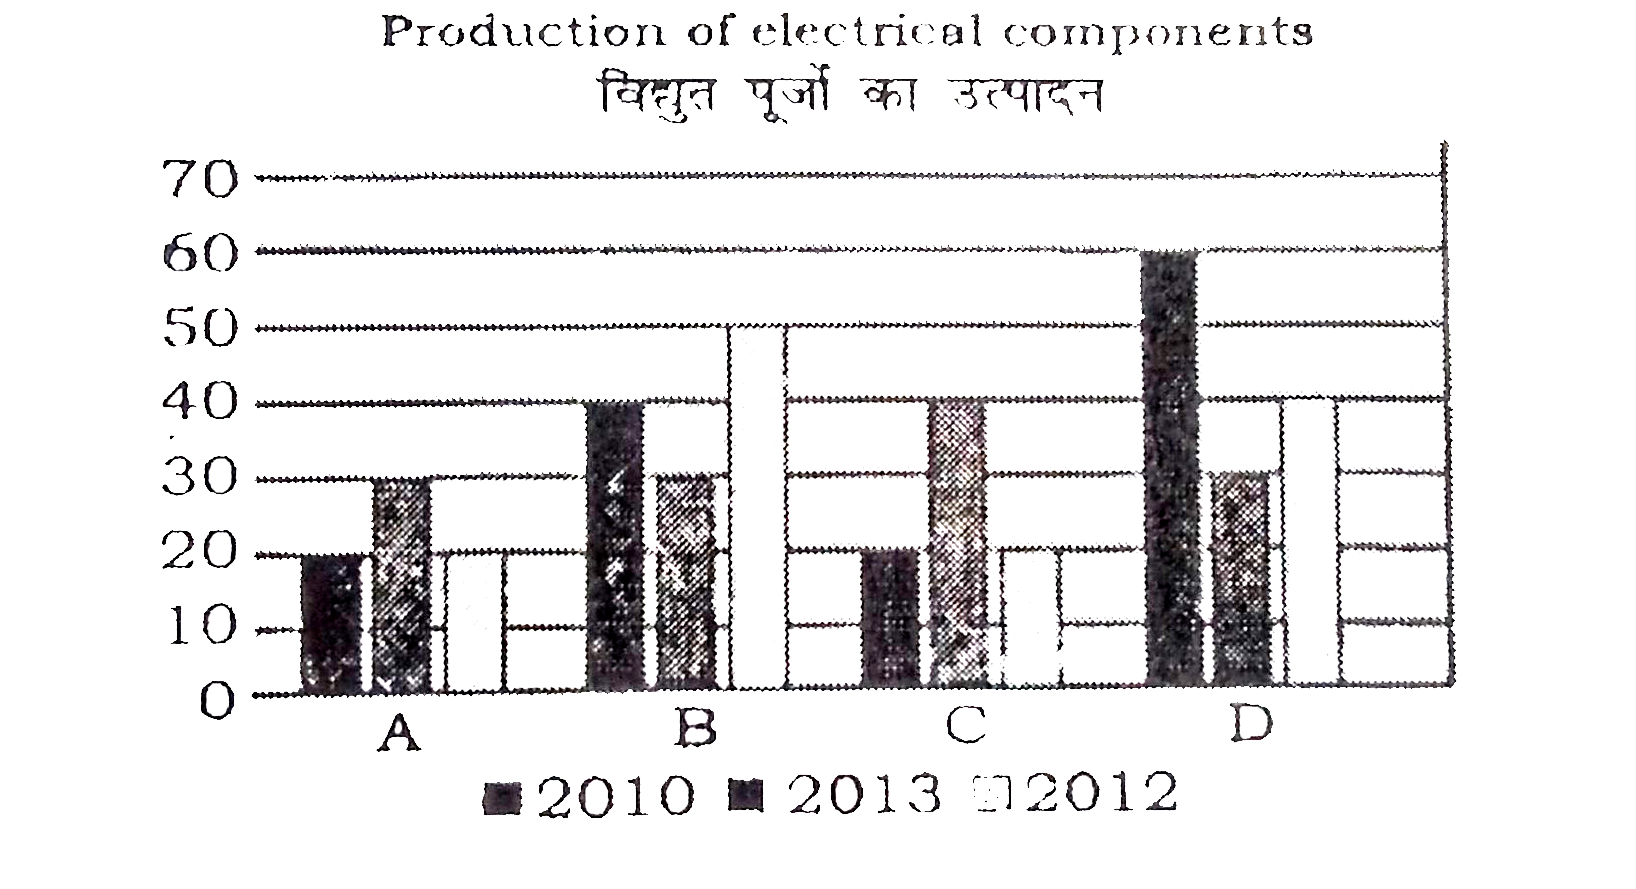
- निचे दिए गए ग्राफ का ध्यान पूर्वक अध्यन करे और दिए गए पर्सेनो (147-150...
Text Solution
|
- एक टी. वी बनाने के कारखाने में मशीने A,B और C कुल उत्पादन का क्रमशः ...
Text Solution
|
- निचे दिये गये ग्राफ में दो प्रकार के वाहनों A व B के छ वर्षो के प्रद...
Text Solution
|
- निचे दिये गये ग्राफ में दो प्रकार के वाहनों A व B के छ वर्षो के प्रद...
Text Solution
|
- Study the following graph which shows the production (in thousand) of ...
Text Solution
|
- The average Kharif production of the given years is- दिए गए वर्षों में...
Text Solution
|
- The following line diagram represents the yearly sales figure of a com...
Text Solution
|
- The following line diagram represents the yearly sales figure of a com...
Text Solution
|
- The table shows the production of different types of cars (in thousand...
Text Solution
|