


Similar Questions
Explore conceptually related problems
Recommended Questions
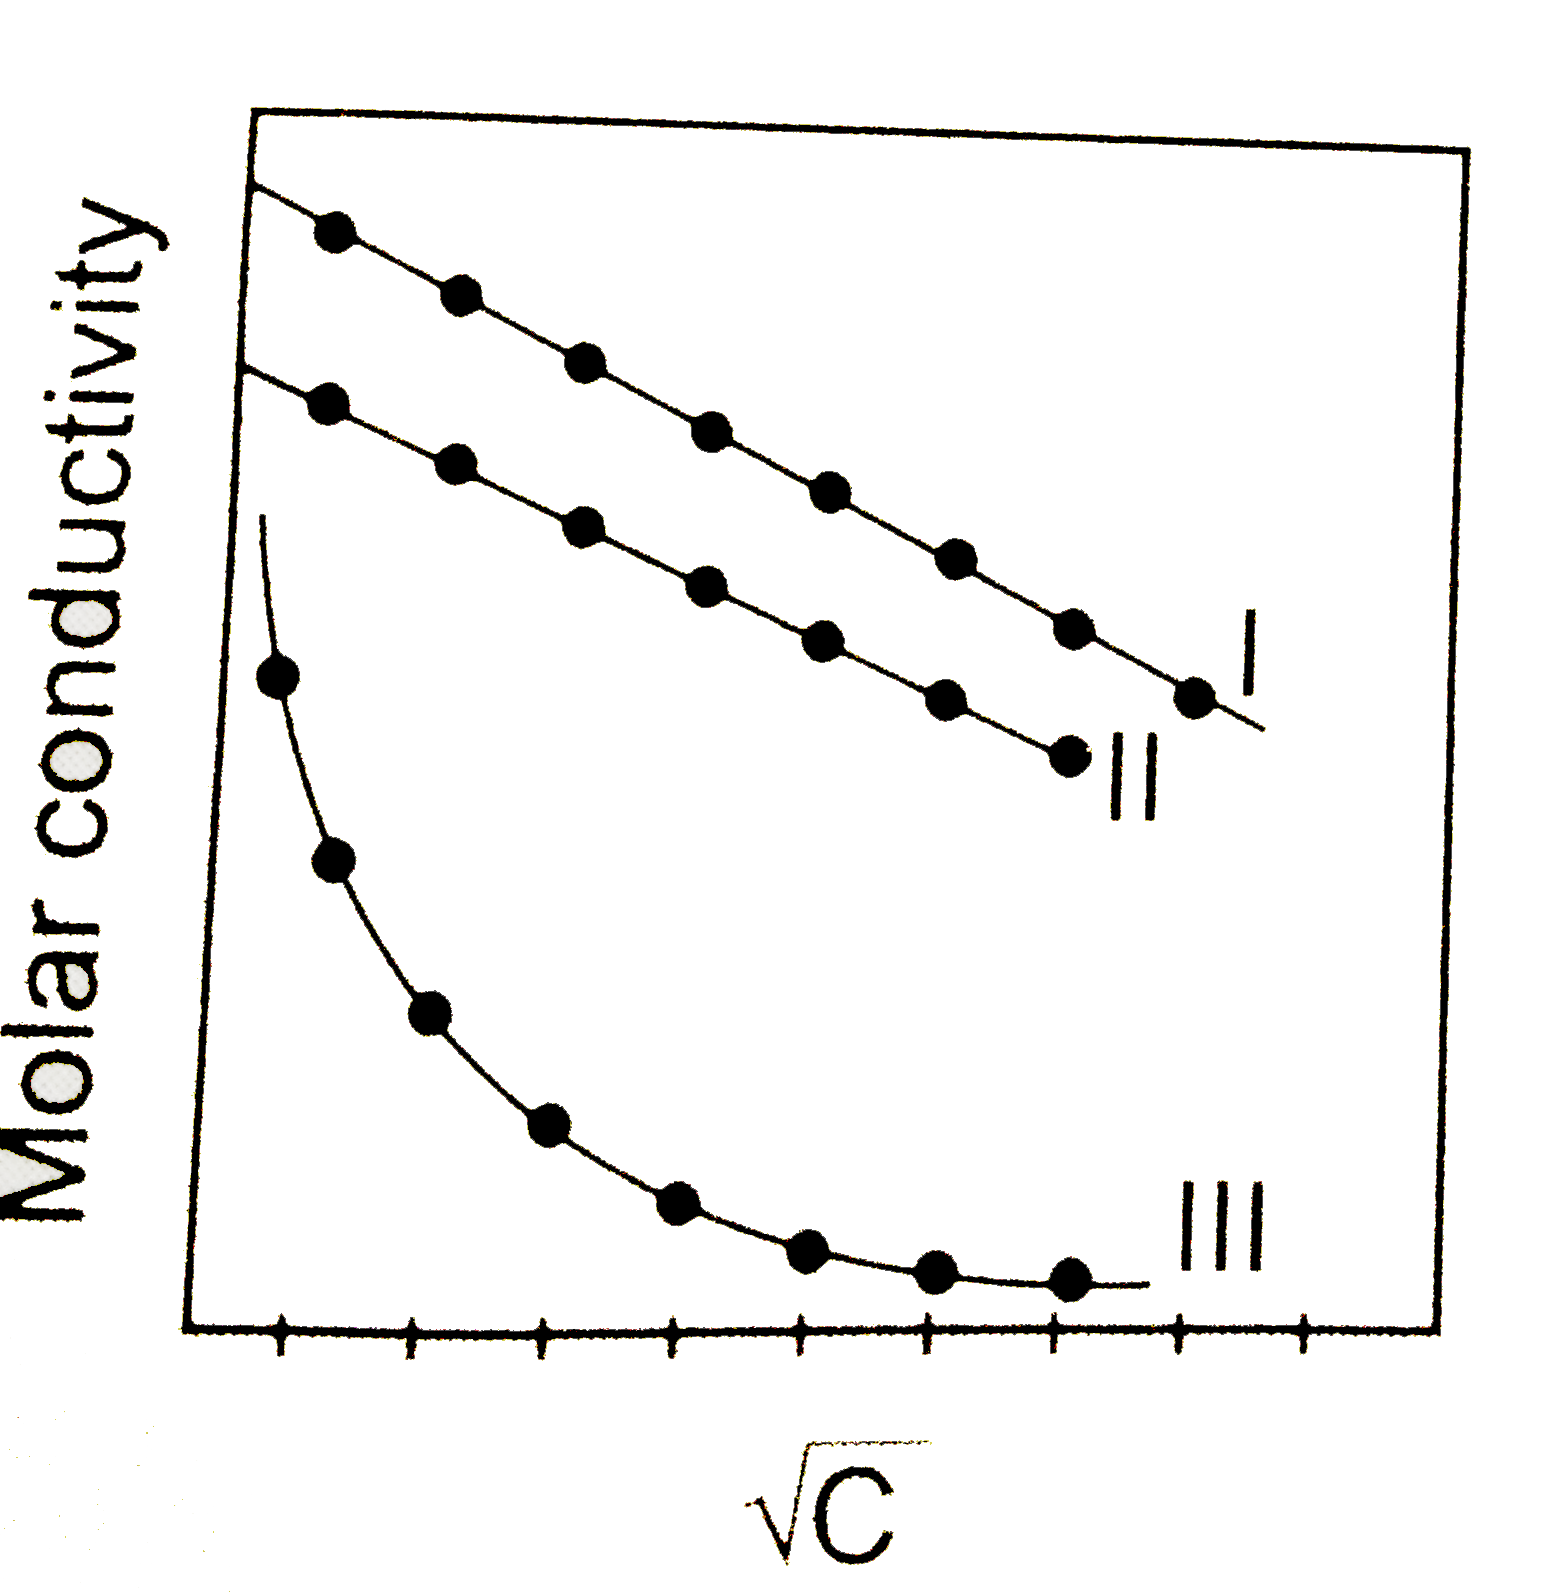
- A graph was plotted between molar conductivity of various electrolytes...
Text Solution
|
- For an electrolyte solution of 0.05 mol L^(-1) , the conductivity has...
Text Solution
|
- A graph was plotted between the molar conductance of various electroly...
Text Solution
|
- A graph was plotted between molar conductivity of various electrolytes...
Text Solution
|
- Molar conductance Lamda(m) is plotted against sqrt(C) (mol "litre"^(-1...
Text Solution
|
- Molar conductance Lamda(m) is plotted against sqrt(C) (mol "litre"^(-1...
Text Solution
|
- Which one of the following graphs between molar conductivity (A(m)) ...
Text Solution
|
- Draw a graph between Lambda(m)^(@) and sqrtC for strong and weak elect...
Text Solution
|
- Above plot represents the variation of molar conductance against sqrtC...
Text Solution
|