


Similar Questions
Explore conceptually related problems
Recommended Questions
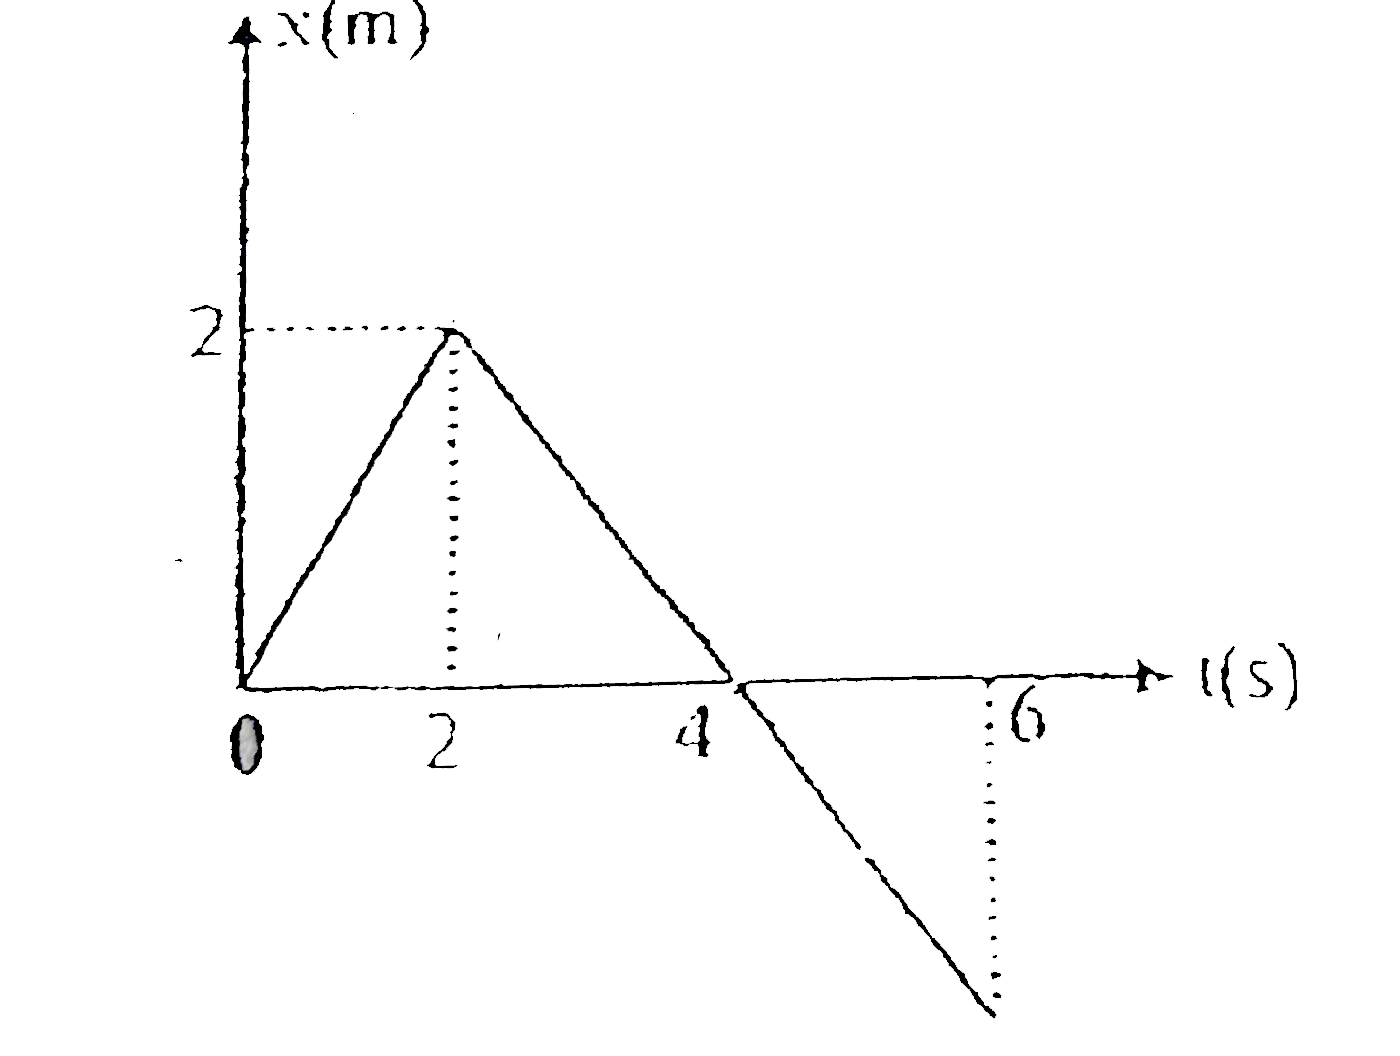
- Position time graph of a particle of mass 2 kg is shown in figrure. To...
Text Solution
|
- Displacement of a particle of mass 2 kg varies with time as s=(2t^(2)-...
Text Solution
|
- The velocity-time graph of a particle moving in a straight line is sho...
Text Solution
|
- Position time graph of a particle of mass 2 kg is shown in figrure. To...
Text Solution
|
- In the figure given below, the position–time graph of a particle of ma...
Text Solution
|
- Fig. shows the position-time graph of a particle of mass 4 kg. What is...
Text Solution
|
- Velocity-time graph of a particle moving in a straight line is shown i...
Text Solution
|
- Velocity - time graph of a particle moving in a straight line is as sh...
Text Solution
|
- Displacement of a particle of mass 2 kg varies with time as s=(2t^(2)-...
Text Solution
|