


Similar Questions
Explore conceptually related problems
Recommended Questions
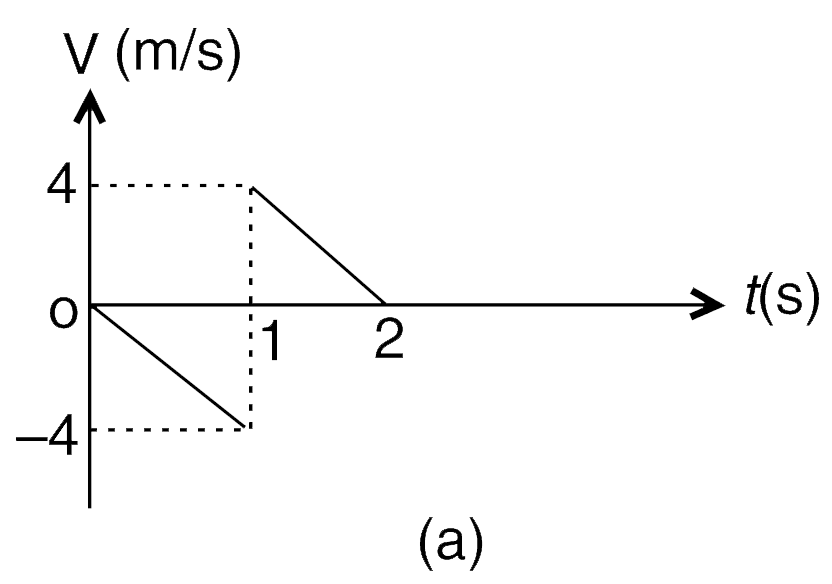
- The velocity (V) – time (t) graphs for two particles A and B moving re...
Text Solution
|
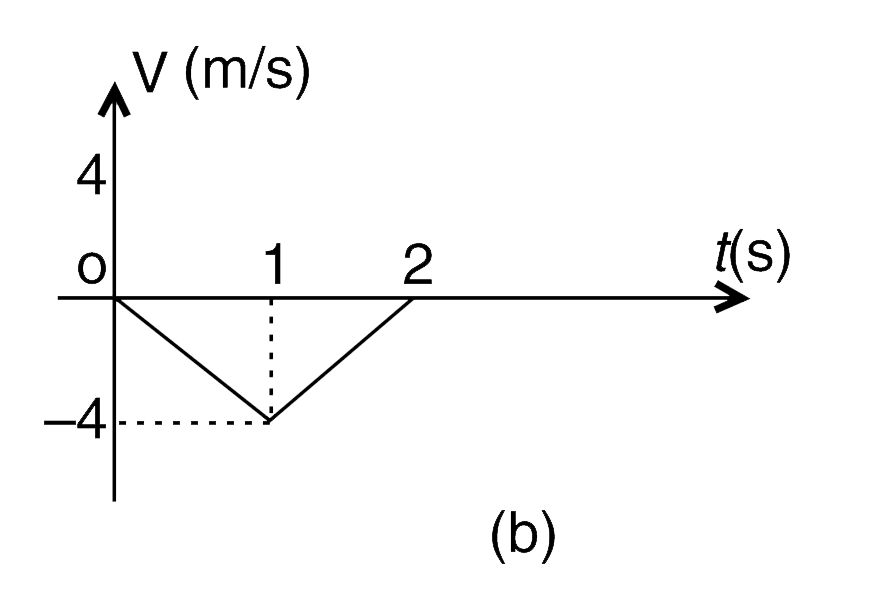
- Velocity-time graph of a particle moving in a straight line is shown i...
Text Solution
|
- Acceleration-time graph of a particle moving in a straight line is as ...
Text Solution
|
- A particle starts moving rectilinearly at time t = 0 such that its vel...
Text Solution
|
- The x-t graph of a particle moving along a straight line is shown in f...
Text Solution
|
- A particle moves rectilinearly possessing a parabolic s-t graph. Find ...
Text Solution
|
- The x-t graph of particle moving along a straight line is shown in fig...
Text Solution
|
- For a particle moving in a straight line, the position-time graph is a...
Text Solution
|
- A particle is moving along the x-axis. Consider it’s a-t graph. If ini...
Text Solution
|