


Similar Questions
Explore conceptually related problems
Recommended Questions
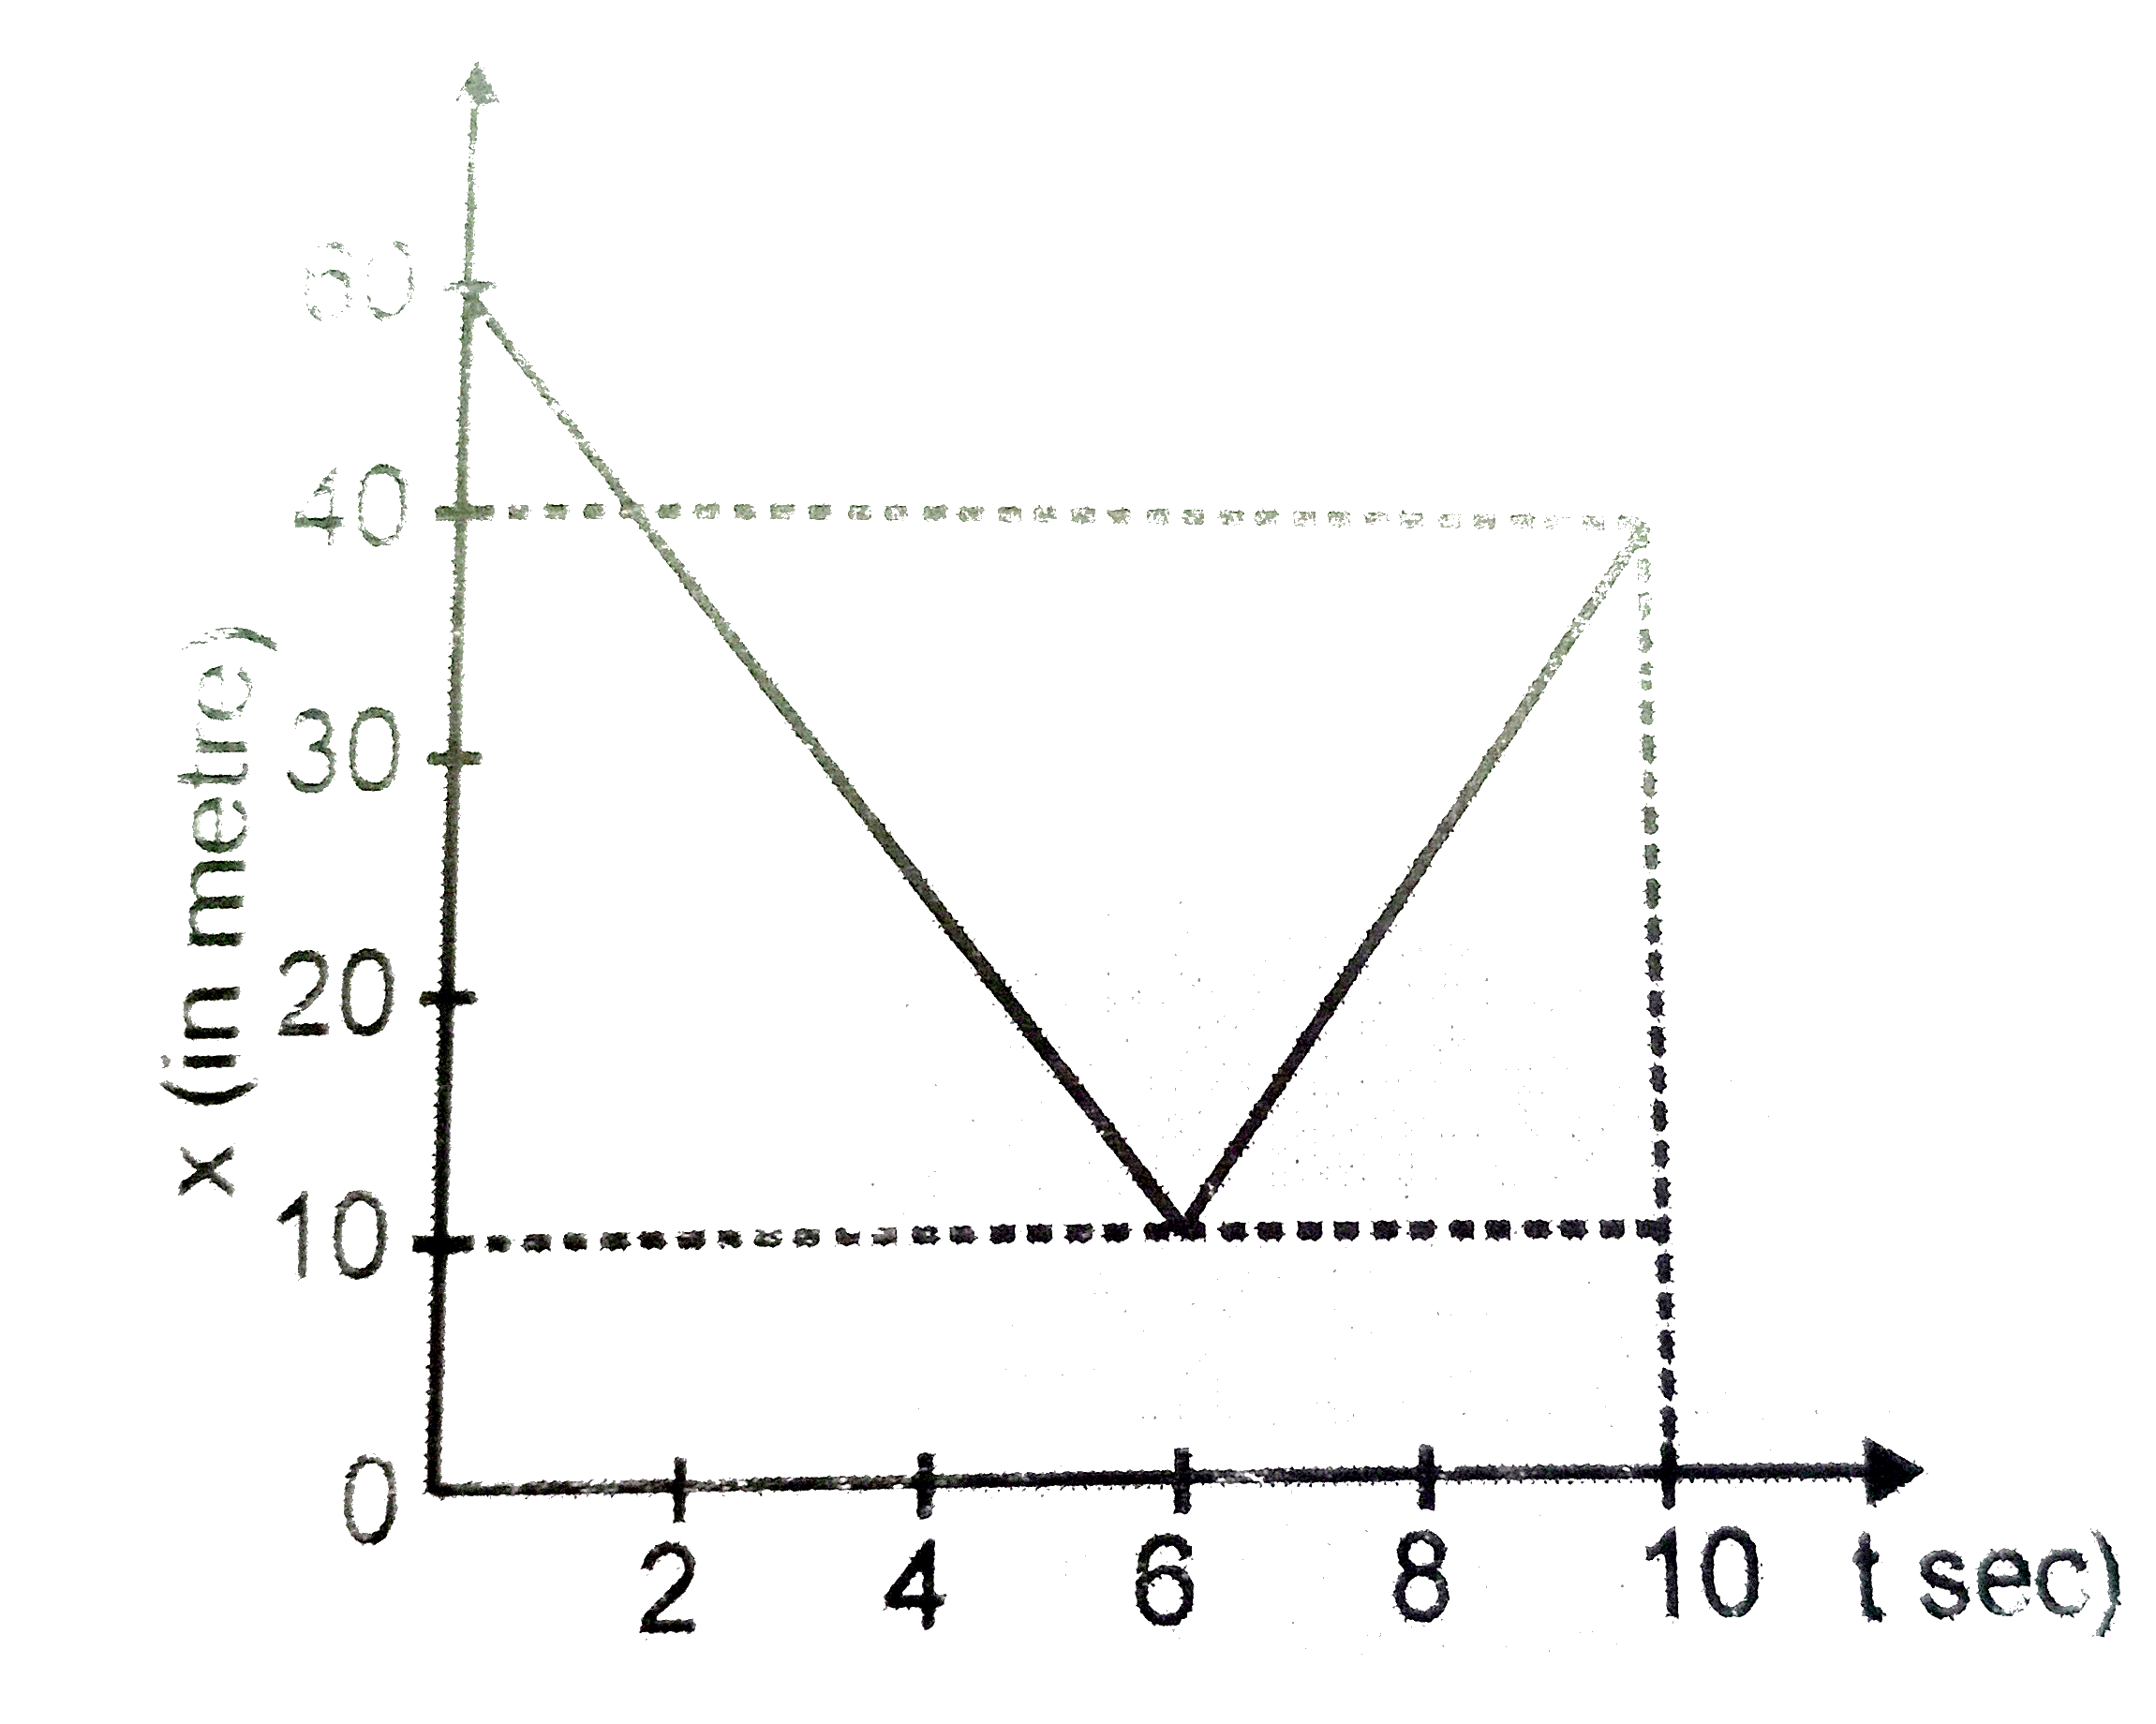
- The fig. shows the displacement time graph of a particle moving on a s...
Text Solution
|
- The figure shows a velocity-time graph of a particle moving along a st...
Text Solution
|
- Figure shows the velocity time graph of a particle moving along straig...
Text Solution
|
- The fig. shows the displacement time graph of a particle moving on a s...
Text Solution
|
- The velocity-time graph of a particle moving along a straight line is ...
Text Solution
|
- The figure shows a velocity-time graph of a particle moving along a st...
Text Solution
|
- The figure shows a velocity-time graph of a particle moving along a st...
Text Solution
|
- The velocity - time graph of a particle moving along a straight line i...
Text Solution
|
- The velocity-time graph of a particle moving along a straight line is ...
Text Solution
|