


Similar Questions
Explore conceptually related problems
Recommended Questions
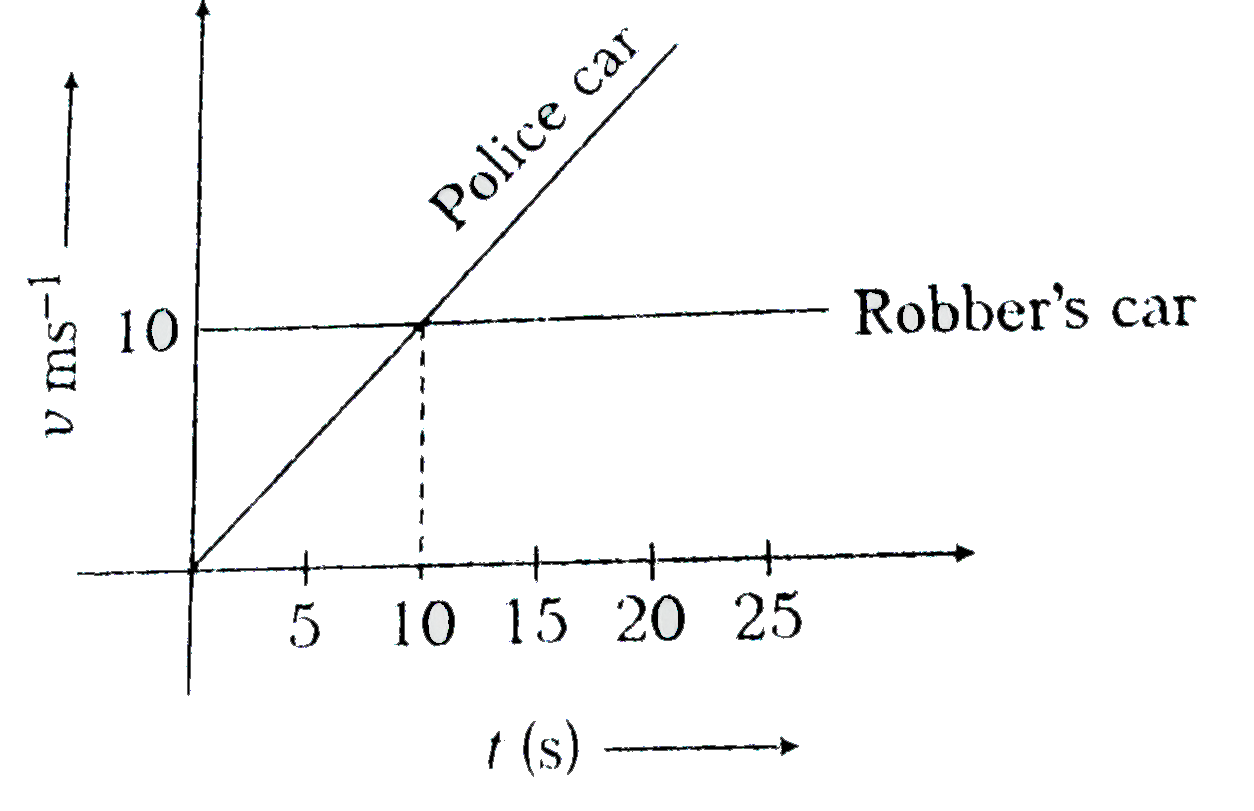
- The velocity-time graph of robber's car and a chasing police car are s...
Text Solution
|
- Velocity-time graph for a car is semicircle as shown here. Which of th...
Text Solution
|
- The velocity-time graph of a car moving along a straight road is shown...
Text Solution
|
- A car is moving on a straight road. The velocity of the car varies wit...
Text Solution
|
- The velocity- time graph of car moving on a straight track is given be...
Text Solution
|
- The velocity-time graph of robber's car and a chasing police car are s...
Text Solution
|
- The velocity-time graph of a car moving along a straight road is shown...
Text Solution
|
- The speed-time graph for a car is shown is Fig. Which part of the...
Text Solution
|
- The speed time graph for a car is shown in fig 8.12 Which part of...
Text Solution
|