


Similar Questions
Explore conceptually related problems
Recommended Questions
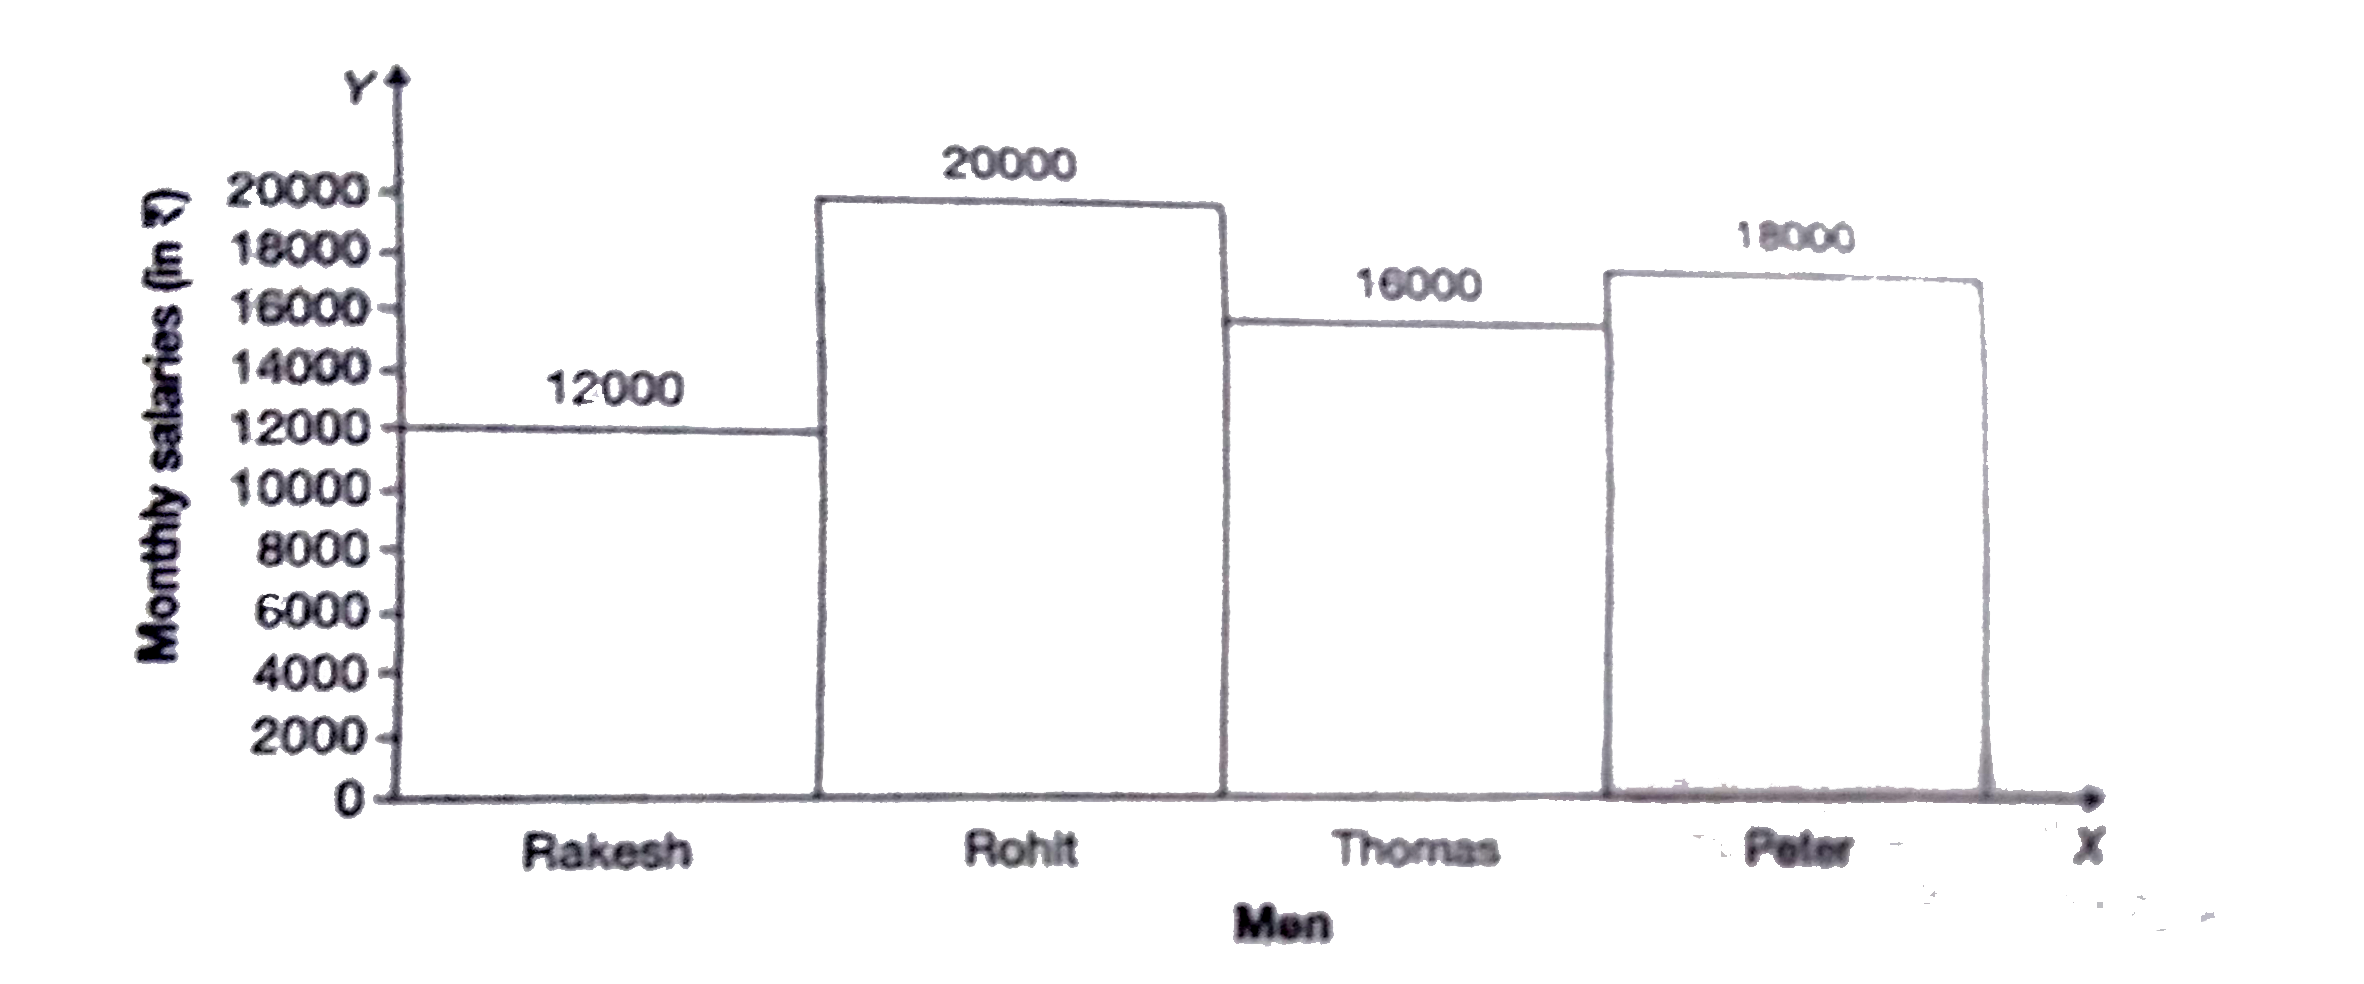
- The histogram given below shows the monthly salaries of four men. Stud...
Text Solution
|
- The histogram given below shows the monthly salaries of four men. Stud...
Text Solution
|
- The inequation represented by the graph given below is : <img src="htt...
Text Solution
|
- The total monthly salary of two persons is RS 7500. They spend 90% and...
Text Solution
|
- Sarita spends 65% of her salary and the rest she saves . If sh...
Text Solution
|
- sarita spends 65% of her salary and the rest she saves . If she saves ...
Text Solution
|
- A person of his monthly salary 80% Spends If his monthly savings ₹1,20...
Text Solution
|
- A man saves Rs. 690 every month. This is 2/17 of his monthly salary. C...
Text Solution
|
- The sum of salaries of A and B is Rs. 43000. A spends 95% of his salar...
Text Solution
|