


Similar Questions
Explore conceptually related problems
Recommended Questions
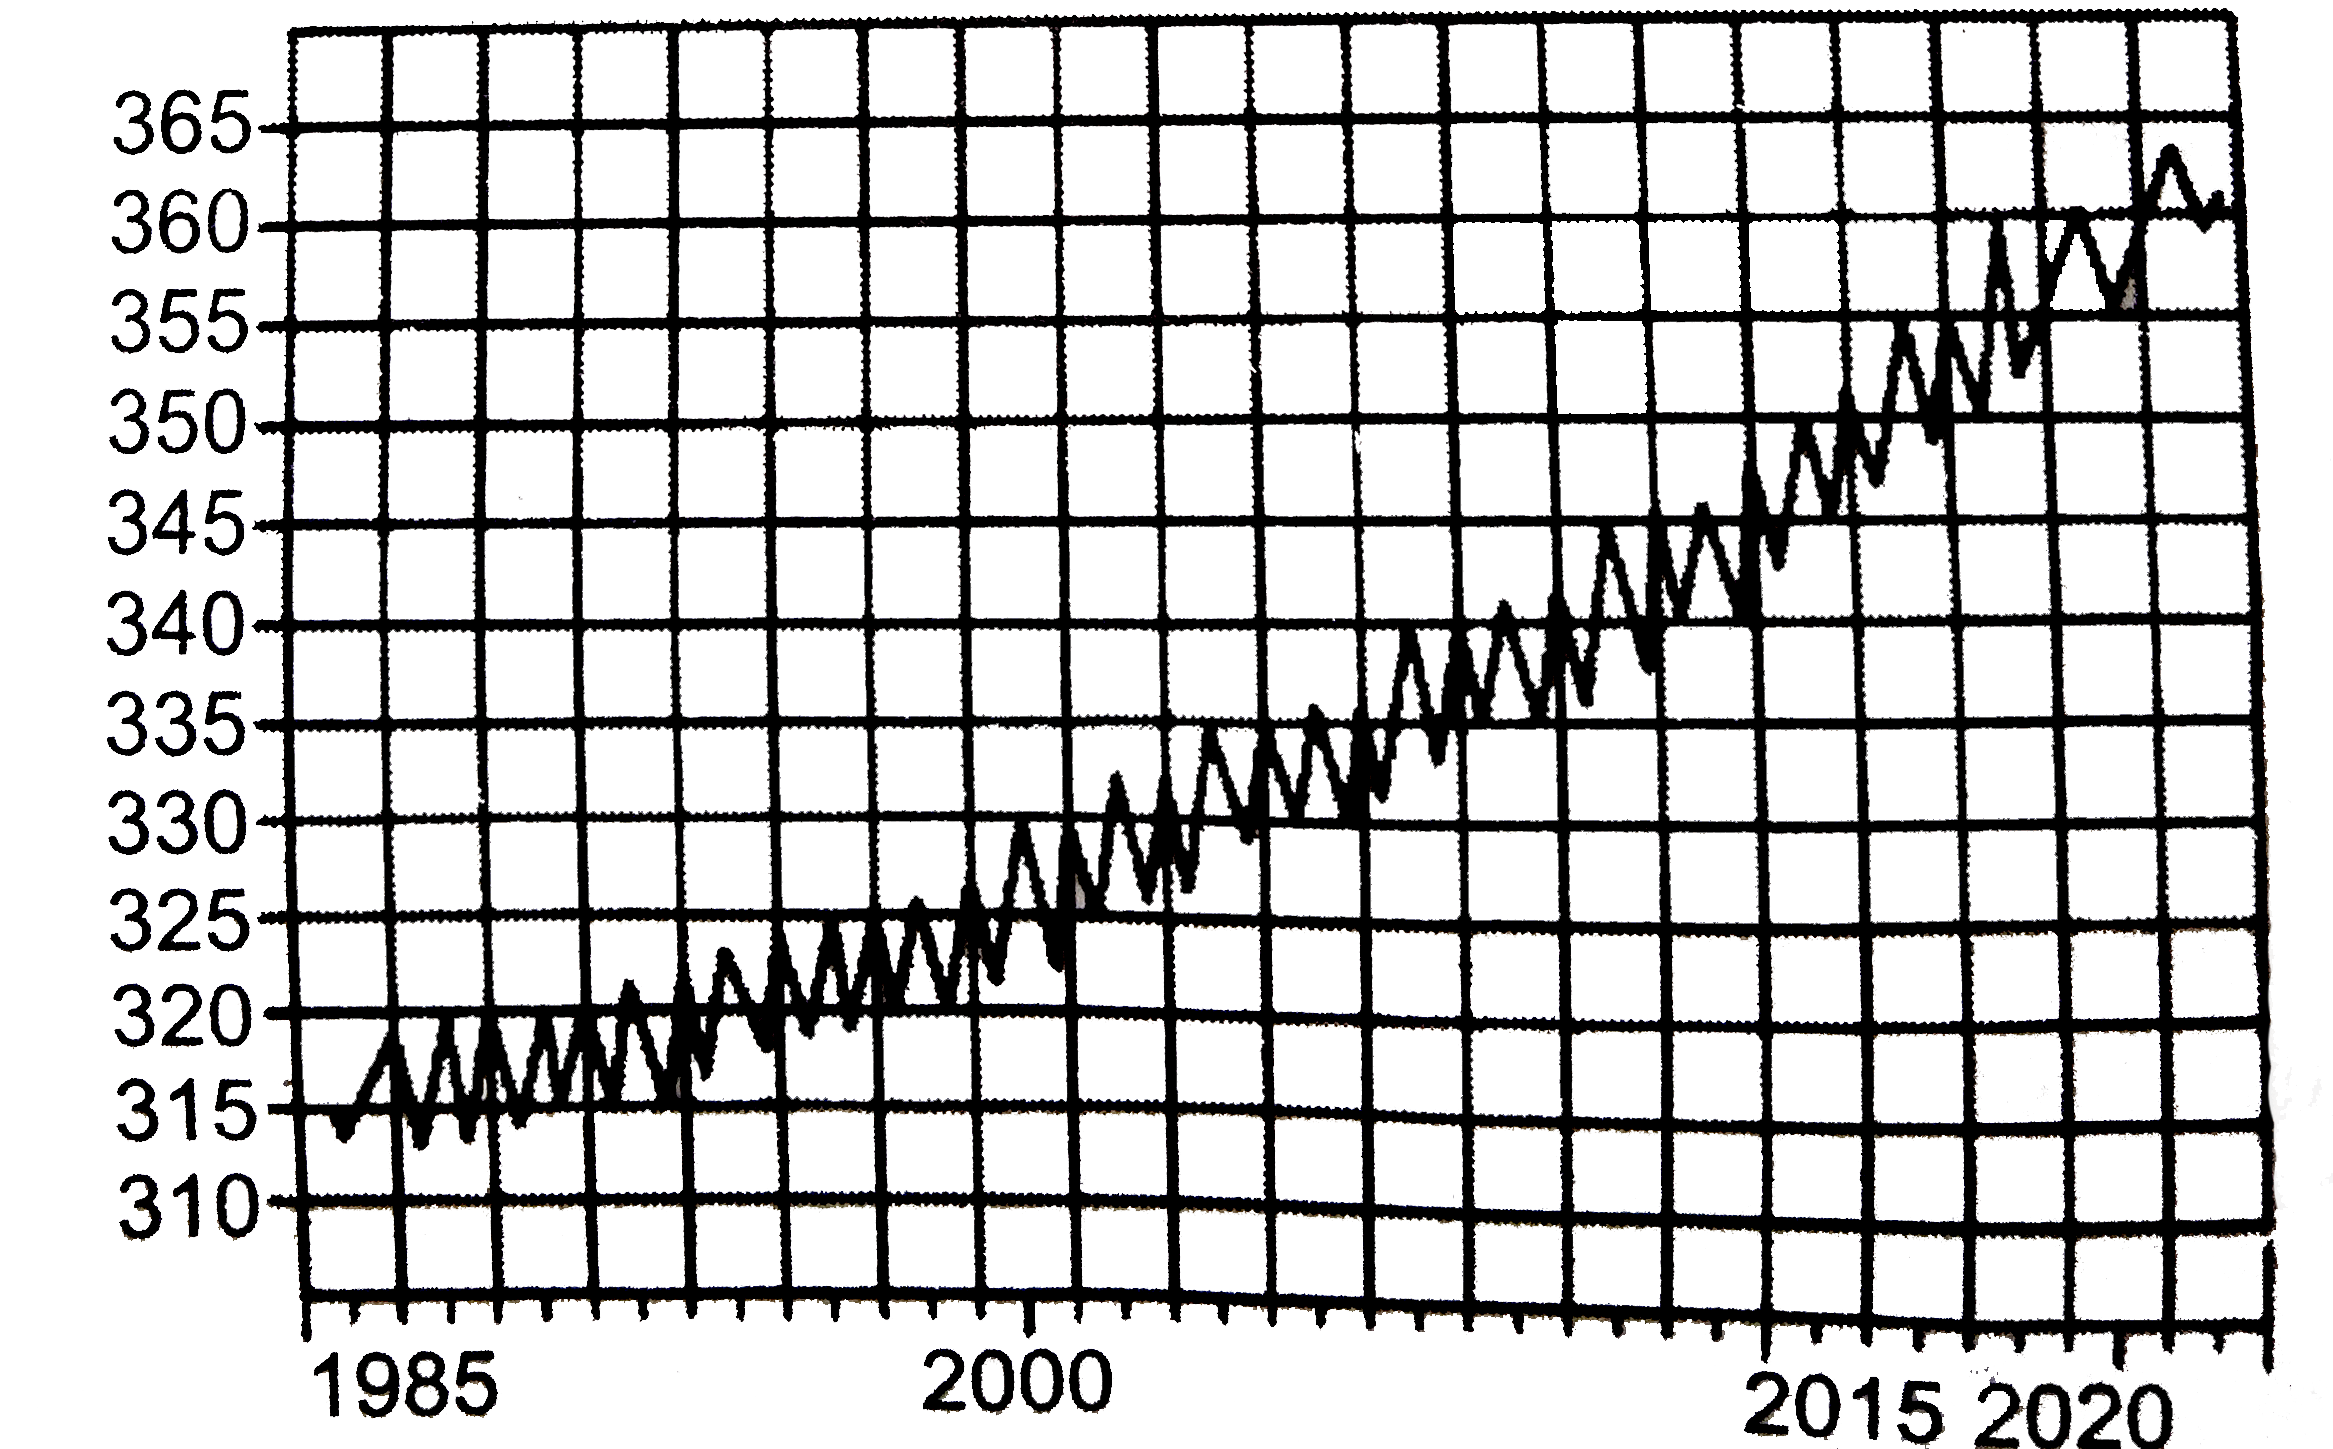
- The figure shows increase in CO(2) content (ppm) from 1985 to 2015 in ...
Text Solution
|
- The figure shows increase in CO(2) content (ppm) from 1985 to 2015 in ...
Text Solution
|
- The CO(2) content by volume, in the atmospheric air is about
Text Solution
|
- CO(2) content of atmosphere has increased in the last 150 years from
Text Solution
|
- ग्राफ में किसी देश विभिन्न वर्षो में उत्पादन की दर्शाया गया हैं ग्राफ ...
Text Solution
|
- Atmospheric content of CO(2) is
Text Solution
|
- The CO(2) content by volume, in the atmospheric air is about
Text Solution
|
- Previous Year Paper 2015-Delhi
Text Solution
|
- Previous Year Paper 2015-Delhi
Text Solution
|