


Similar Questions
Explore conceptually related problems
Recommended Questions
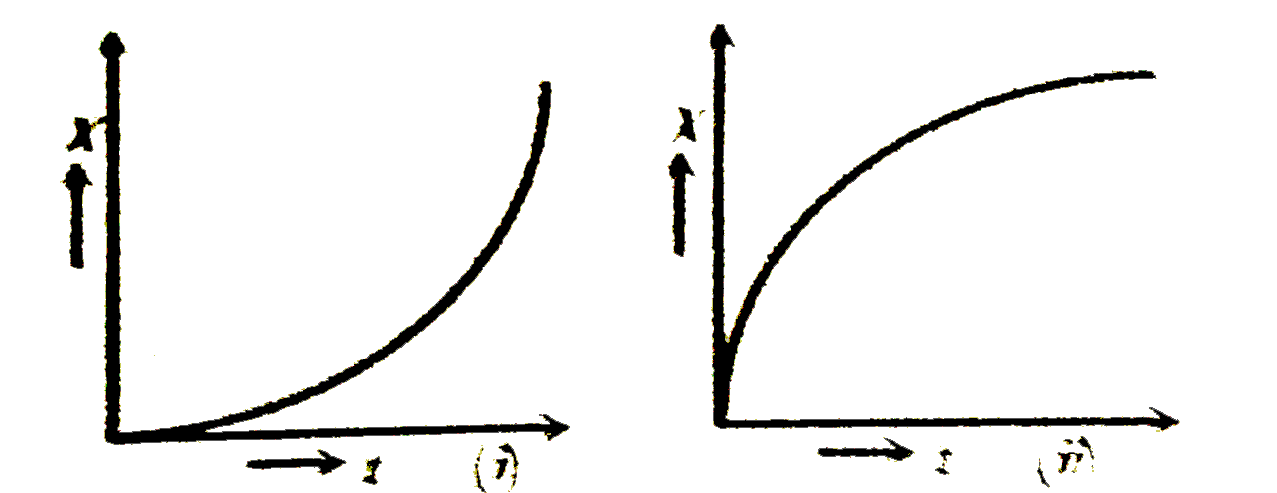
- Figures (i) and (ii) below show the displacement-time graphs of two pa...
Text Solution
|
- Figure shows the displacement time graph of a particle moving on the X...
Text Solution
|
- Figures (i) and (ii) below show the displacement-time graphs of two pa...
Text Solution
|
- The velocity-time graph for a particle moving along X-axis is shown in...
Text Solution
|
- The velocity time graph for a particle moving along x-axis is shown in...
Text Solution
|
- चित्र में x - अक्ष पर चलते एक कण का विस्थापन - समय ग्राफ दि...
Text Solution
|
- The velocity time graph for a particle moving along X-axis is shown in...
Text Solution
|
- Figure show the displacement - time graph of a particle moving on the ...
Text Solution
|
- प्रदर्शित चित्र (i) व (ii) x-अक्ष के अनुदिश गति कर रहे दो कणों के विस्...
Text Solution
|