


Similar Questions
Explore conceptually related problems
Recommended Questions
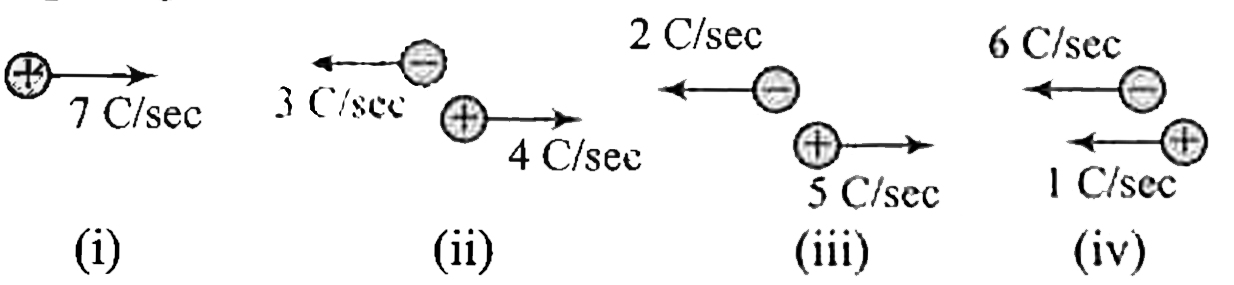
- Following figures show four situations in which positive and negative ...
Text Solution
|
- The figure shows four wire loops, with edge length of either L or 2L. ...
Text Solution
|
- Consider positive and negative charge (all of equal magnitude) moving ...
Text Solution
|
- A figure below shows the forces that three charged particles exert on ...
Text Solution
|
- Following figures show four situations in which positive and negative ...
Text Solution
|
- The figure shows three circuits with identical batteries, inductors an...
Text Solution
|
- The diagram below show region of equipotentials. A positive charge is ...
Text Solution
|
- The figure shows three circuit with identical batteries, inductors and...
Text Solution
|
- A moving charged particle is not deflected when it passes through a re...
Text Solution
|