 .
.


Similar Questions
Explore conceptually related problems
Recommended Questions
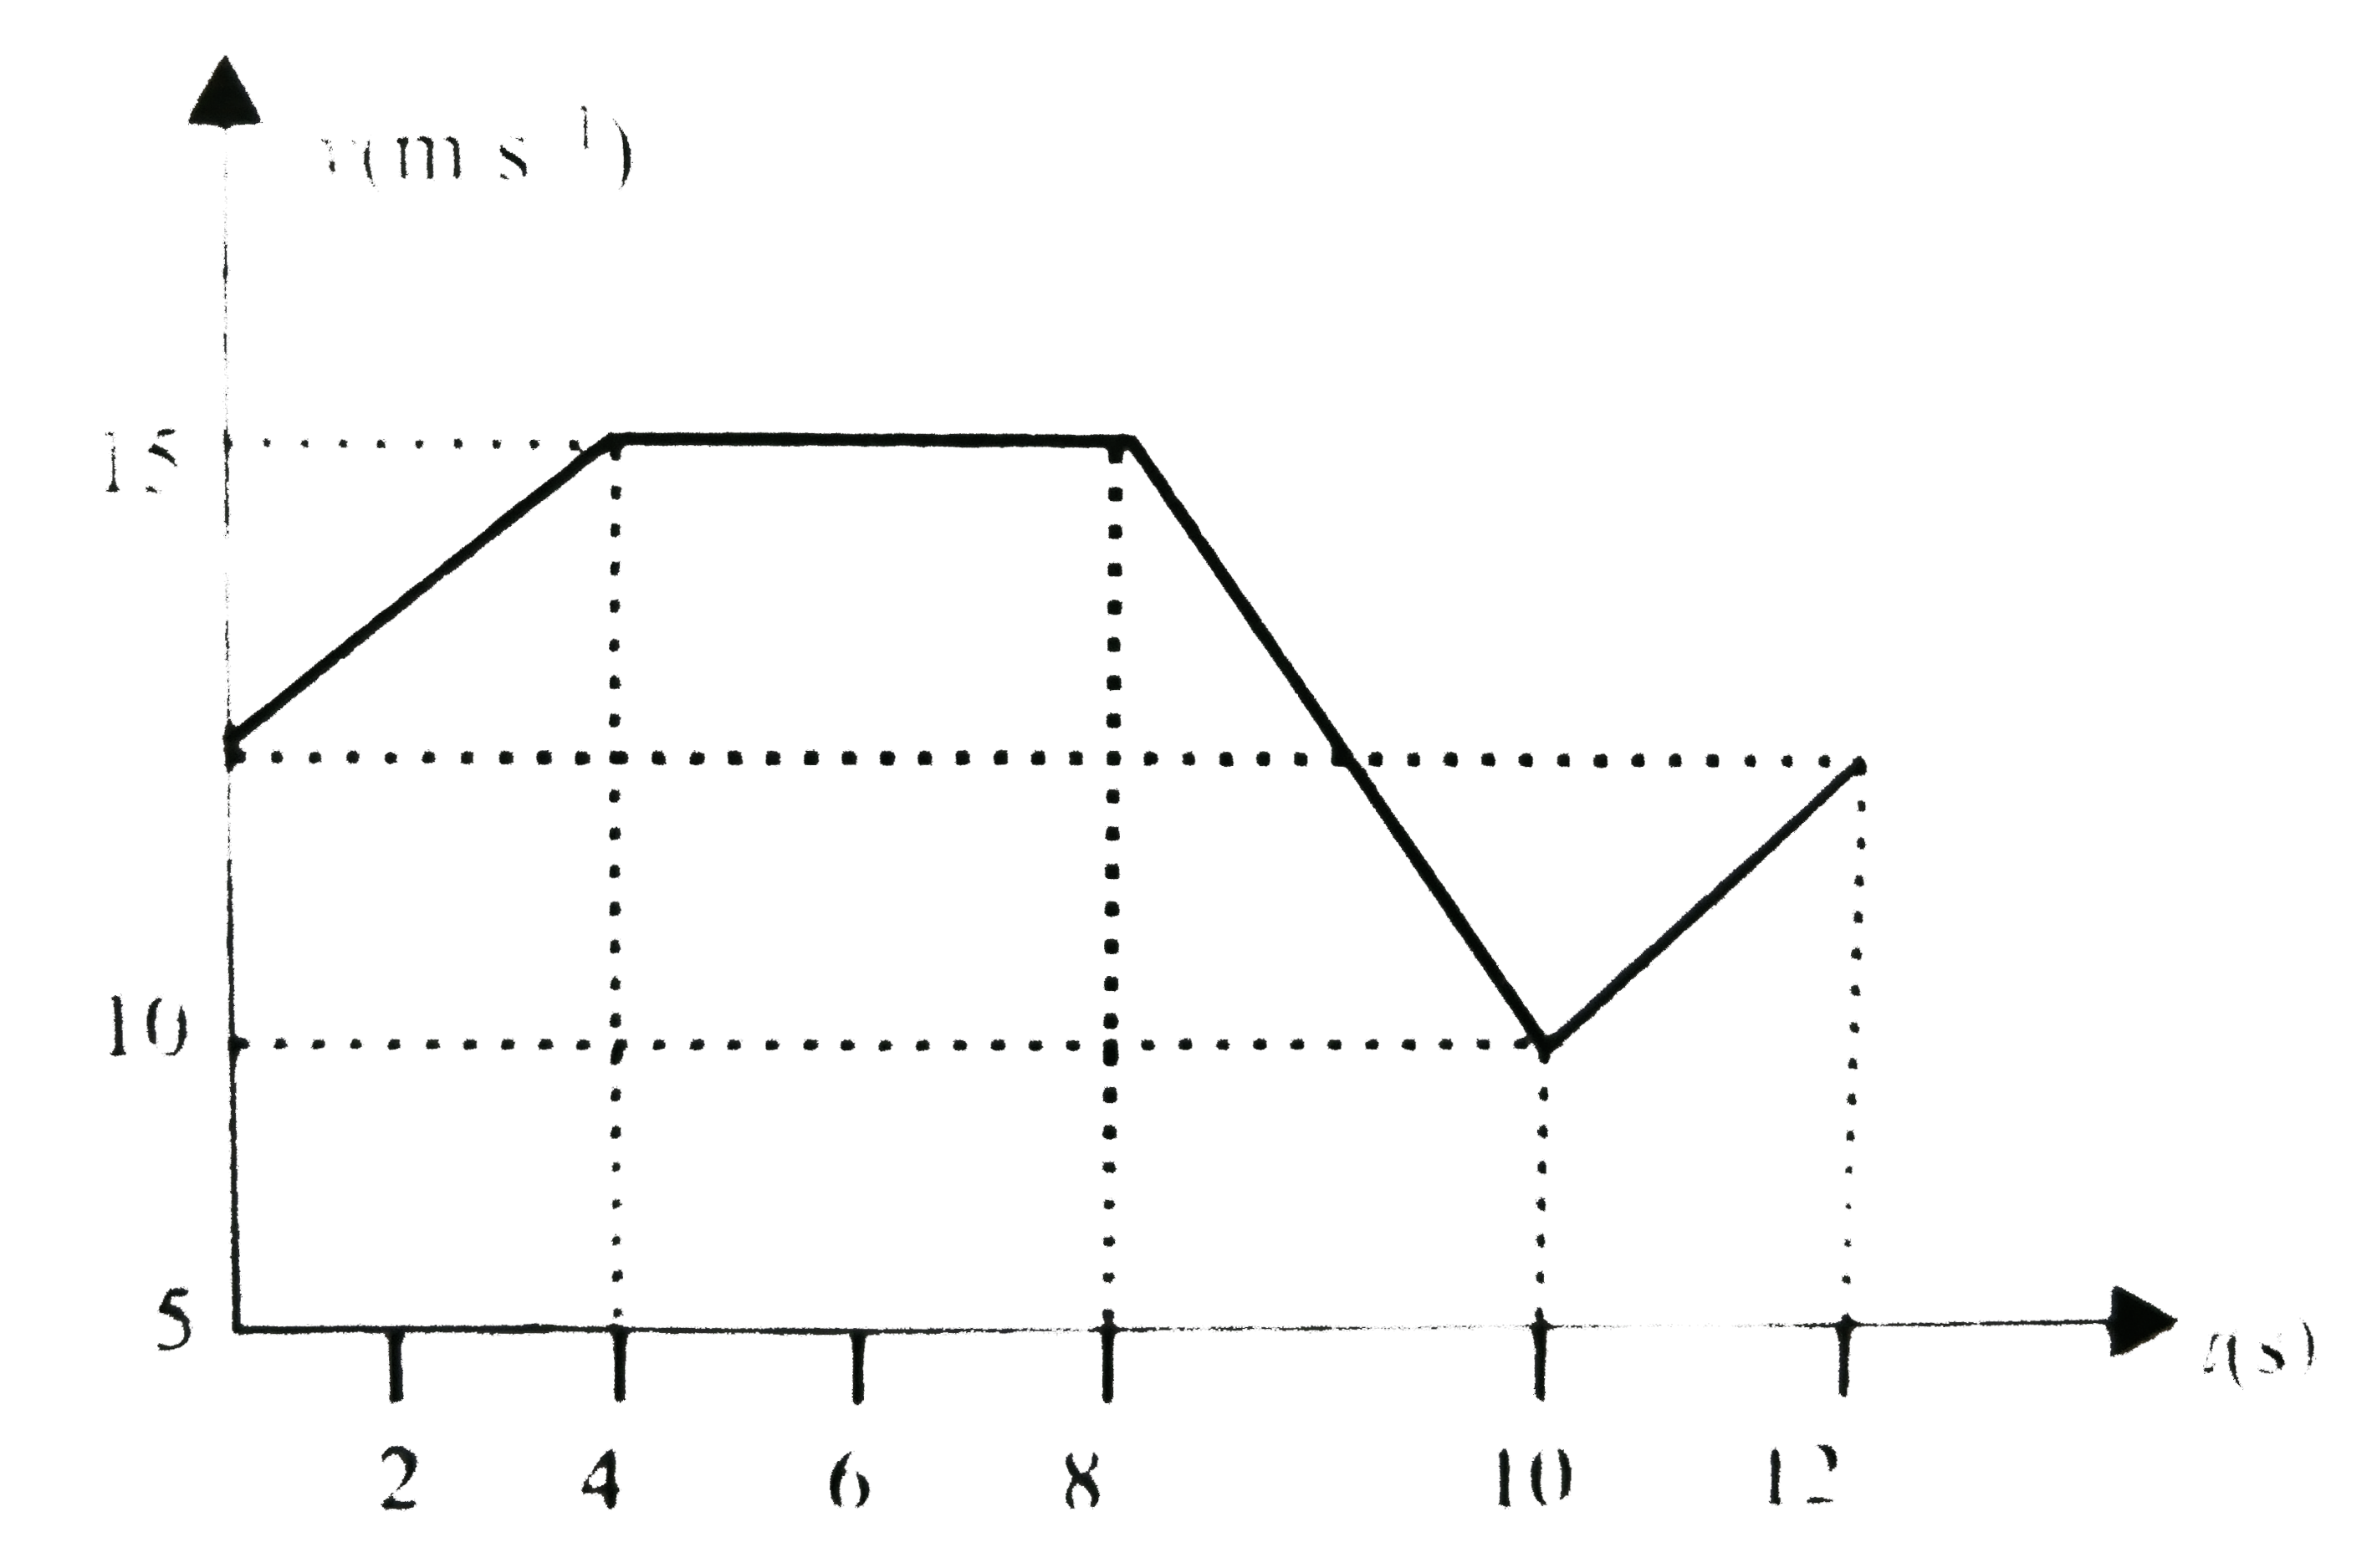
- The velovity-time graph of a particle moving in a straitht line is sho...
Text Solution
|
- Acceleration-time graph of a particle moving in a straight line is as ...
Text Solution
|
- The velovity-time graph of a particle moving in a straitht line is sho...
Text Solution
|
- The x-t graph of a particle moving along a straight line is shown in f...
Text Solution
|
- For a particle moving in a straight line, the velocity-time graph is a...
Text Solution
|
- Acceleration (a) -displacement (s) graph of a particle moving in a str...
Text Solution
|
- A particle is moving in a straight line. Particle was initially at res...
Text Solution
|
- The velocity -time (v - t) graph of a particle moving in a straight li...
Text Solution
|
- Acceleration (a)-displacement(s) graph of a particle moving in a strai...
Text Solution
|