A
B
C
D
Text Solution
Verified by Experts
The correct Answer is:


Topper's Solved these Questions
SAMPLE PAPER 2019
X BOARDS|Exercise SECTION-A (FILL IN THE BLANKS)|3 VideosSAMPLE PAPER 2019
X BOARDS|Exercise SECTION-A (FILL IN THE BLANKS) 12 (a)|1 VideosSAMPLE PAPER 2019
X BOARDS|Exercise 38B|1 VideosQUESTION PAPER 2023
X BOARDS|Exercise Question|88 VideosX Boards
X BOARDS|Exercise All Questions|494 Videos
Similar Questions
Explore conceptually related problems
X BOARDS-SAMPLE PAPER 2019-SECTION-A (MULTIPLE CHOICE QUESTIONS)
- HCF of 168 and 126 is
Text Solution
|
- Empiricla relationship between the three measures of central tendency ...
Text Solution
|
- 325 can be expressed as a product of its primes as
Text Solution
|
- One card is drawn from a well shuffled deck of 52 cards. The probabili...
Text Solution
|
- The sum of the zeroes of the polynomial 2x^(2) - 8x+ 6 is
Text Solution
|
- Which of the following is the decimal expansions of a irrational numbe...
Text Solution
|
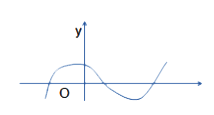
- The following figure shows the graph of y= p(x), where p(x) is a polyn...
Text Solution
|
- The distance of the point P(3, -4) from the origin is
Text Solution
|
- The mid point of the line segment joining the points (-5, 7) and (-1, ...
Text Solution
|