Text Solution
Verified by Experts


Similar Questions
Explore conceptually related problems
Recommended Questions
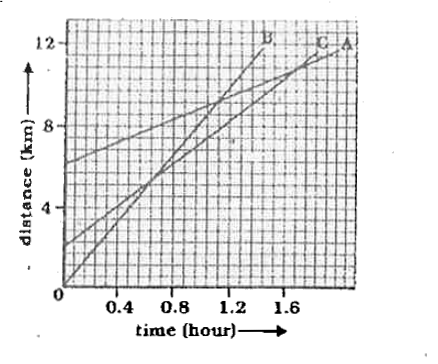
- Fig. shows the distance-time graph of three objects A, B and C. Study ...
Text Solution
|
- Figure shows the distance-time graph of three object A, B and C. Study...
Text Solution
|
- Fig. shows the distance-time graph of three objects A, B and C. Study ...
Text Solution
|
- Fig. shows the distance-time graph of three objects A, B and C. Study ...
Text Solution
|
- Figure shows the distance time graph fo three objects A,B and C. Study...
Text Solution
|
- Figure 3.64 shows the position-time graphs of three car A, B and C. On...
Text Solution
|
- Figure 3.64 shows the position-time graphs of three car A, B and C. On...
Text Solution
|
- Fig 1.11 show the distance - time graphs of three A,B and C. Study th...
Text Solution
|
- Fig 1.11 show the distance - time graphs of three A,B and C. Study the...
Text Solution
|