Text Solution
Verified by Experts


Recommended Questions
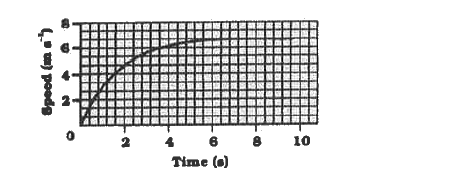
- The speed-time graph for a car is shown is Fig. Find how far does...
Text Solution
|
- Velocity (v) time (t) graph of a car starting from rest is shown in Fi...
Text Solution
|
- The speed-time graph for a car is shown is Figure (a) Find how fa...
Text Solution
|
- सीधी सड़क पर चलती एक कार की चाल समय के साथ ग्राफ चित्र में दिखा...
Text Solution
|
- किसी कार का चाल-समय चित्र में दर्शाया गया है । (a) पहले 4 s में कार ...
Text Solution
|
- किसी कार का ग्राफ सलंग्न चित्र में पदर्शित है। ग्राफ से ज्ञात कीजिये :...
Text Solution
|
- The speed of a car as a function of time as shown figure. Find the acc...
Text Solution
|
- The speed of a car as a function of time as shown figure. Find the acc...
Text Solution
|
- The speed-time graph for a car is shown is Fig. Which part of the...
Text Solution
|