


Similar Questions
Explore conceptually related problems
Recommended Questions
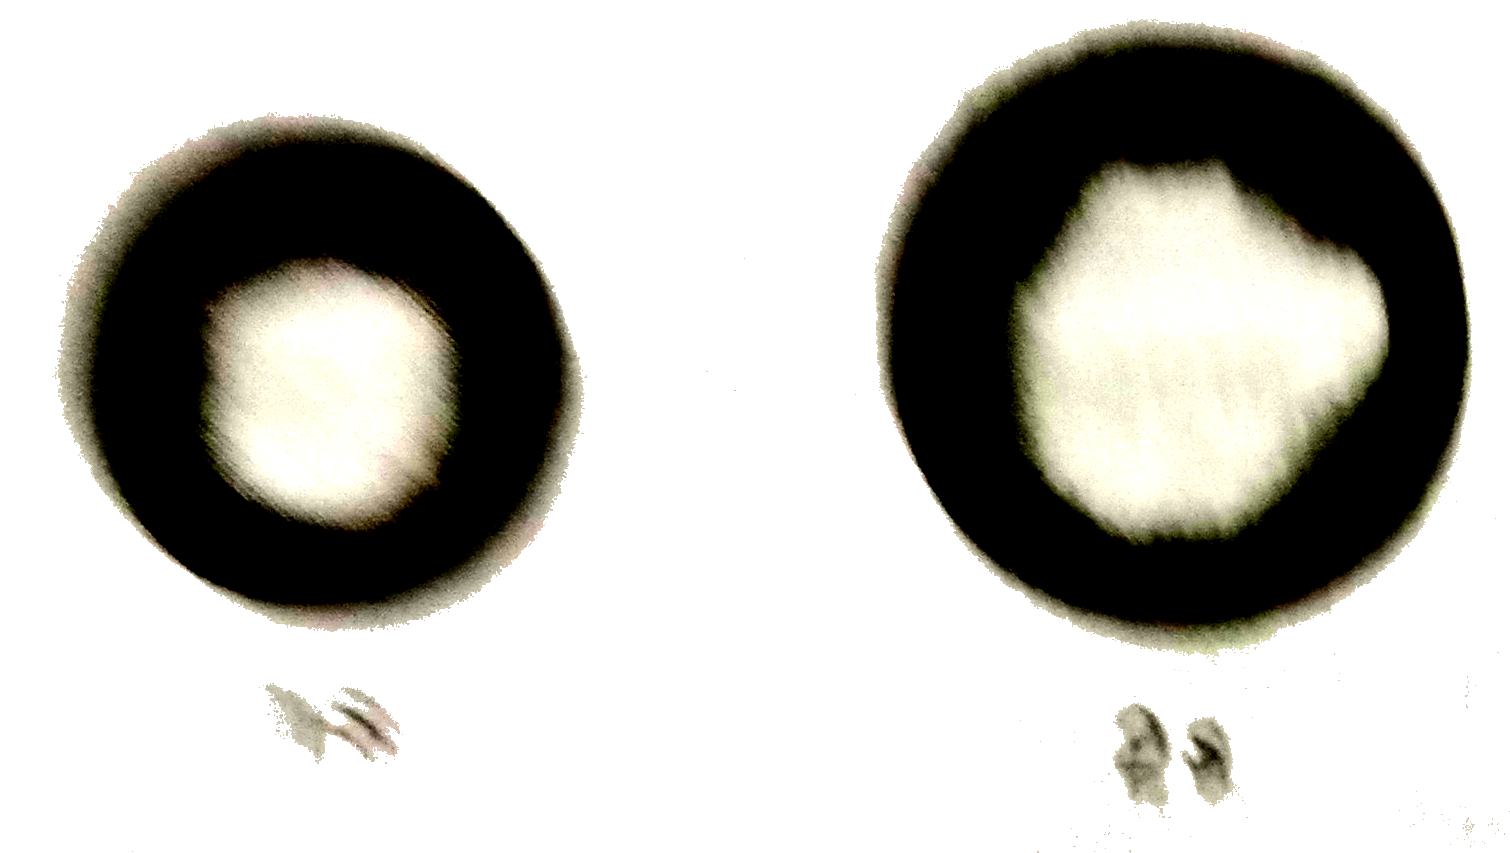
- The probability density plots of 1 s and 2s orbitals are given in figu...
Text Solution
|
- Energy density in the region between 1s and 2s orbital is …………
Text Solution
|
- Statement -I : Probability density of electron is zero at nucleus for...
Text Solution
|
- The probability density plots of 1 s and 2s orbitals are given in figu...
Text Solution
|
- The region where probability density function reduces to zero is calle...
Text Solution
|
- electrophiles are the species which attack the regions of............ ...
Text Solution
|
- The probability density plots of 1 s and 2s orbitals are given in figu...
Text Solution
|
- The probability density plots of Is and 2s orbitals are given in ...
Text Solution
|
- The region where probability density function reduces to zero is calle...
Text Solution
|