


Similar Questions
Explore conceptually related problems
Recommended Questions
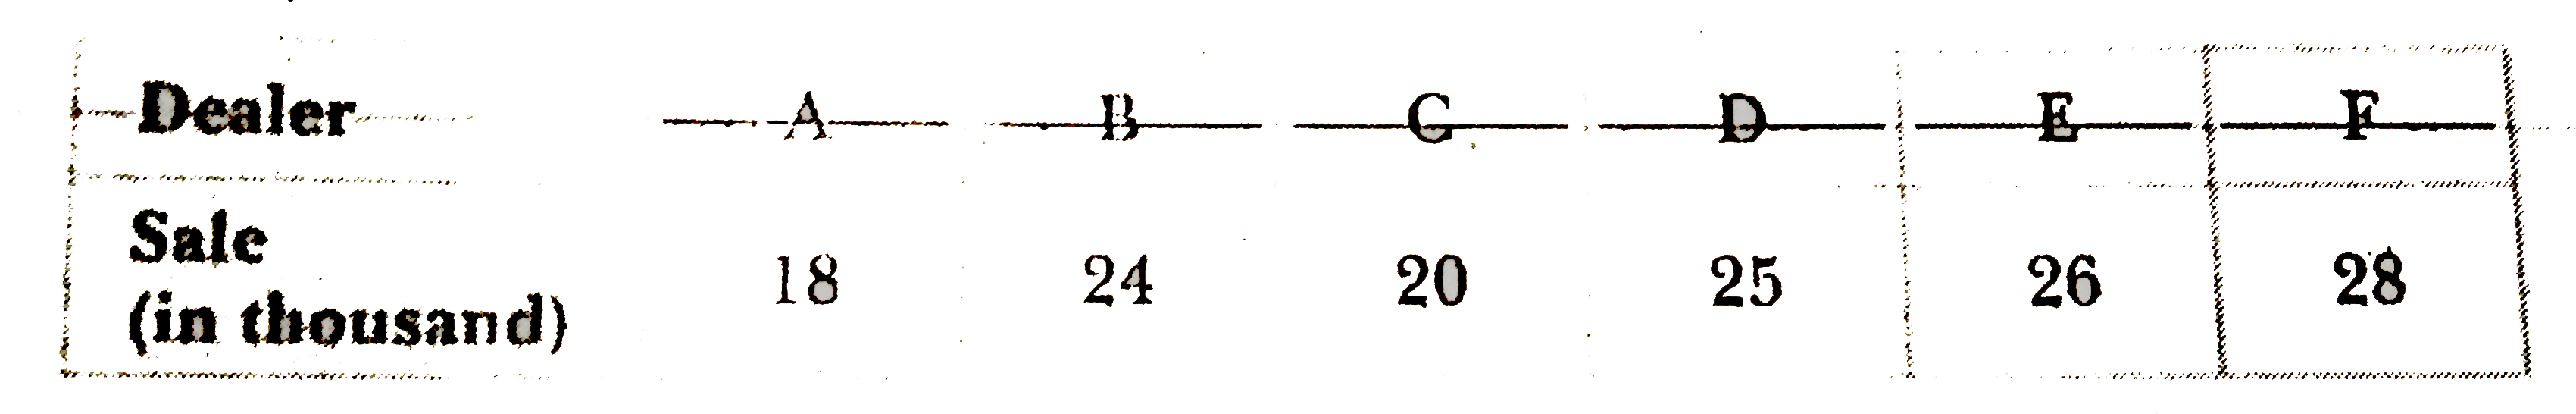
- Given the following data, draw a table showing the sale if LED TV by d...
Text Solution
|
- अपररूपता क्या है ? कार्बन के विभिन्न अपररूपों कस वर्णन कीजिए ।
Text Solution
|
- मिलर के चिंगारी विमुक्ति उपकरण का नामांकित चित्र बनाइए! (वर्णन की आवश्...
Text Solution
|
- भौमिक समय सारणी क्या है? कौन-सा महाकल्प सरीसृप युग कहलाता है और क्यों?
Text Solution
|
- प्राकृतिक चयन सिद्धांत का प्रतिपादन किया था-
Text Solution
|
- भू-चुम्बकत्व के विभिन्न अवयव क्या है ? इनकी परिभाषा दीजिए |
Text Solution
|
- वाटहीन धारा का एक परिपथ आरेख खीचिए।
Text Solution
|
- A .C स्त्रोत की आवृत्ति में परिवर्तन के साथ संधारित्र प्रतिघात ...
Text Solution
|
- यदि एक भिन्न के अंश में इसका हर जोड़ दिया जाए और हर में से अंश घटा दिय...
Text Solution
|