


Similar Questions
Explore conceptually related problems
Recommended Questions
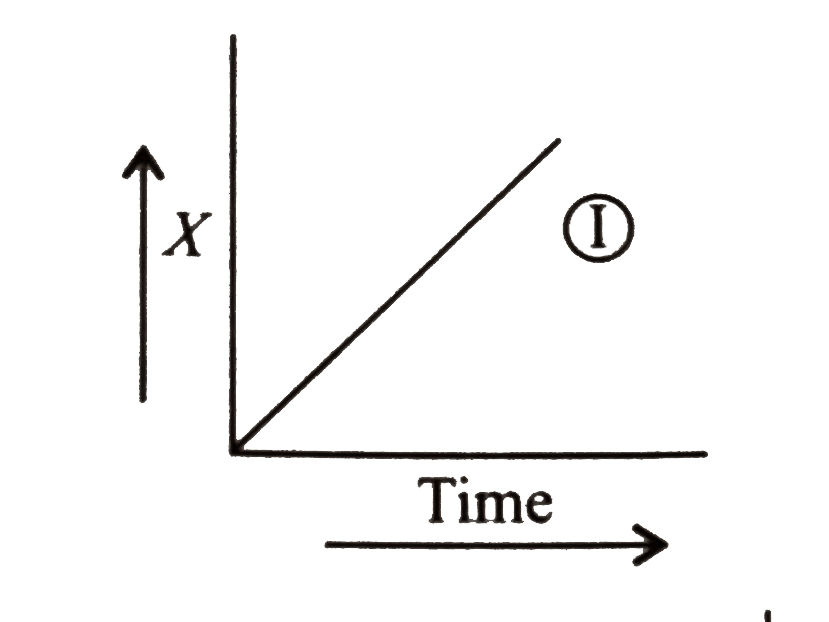
- The graph between concentration (X) of the Product and time of the rea...
Text Solution
|
- For the reaction: aA + bB rarr cC+dD Rate = (dx)/(dt) = (-1)/(a)(d[A])...
Text Solution
|
- Following is the graph between (a-x) and time t for second order react...
Text Solution
|
- The graph between concentration (X) of the Product and time of the rea...
Text Solution
|
- For the reaction AtoB , for which graph between half life (t(1//2)) an...
Text Solution
|
- Graph between concentration of the product and time of the reaction A ...
Text Solution
|
- For a reaction X to Y, the graph of the product concentration (x) vers...
Text Solution
|
- For a reaction of the type Aa+bB rarr products ( -)(d[A])/(dt) is...
Text Solution
|
- शून्य कोटि की अभिक्रिया के लिए समय तथा सान्द्रता के मध्य ग्राफ खींचिए।
Text Solution
|