Home
Class 12
PHYSICS
Which graph best represents the variatio...

Which graph best represents the variation of electric potential as a function of distance from the centre of a uniformly charged solid sphere of charge of radius R ?

A


B

C

D

Text Solution

AI Generated Solution

The correct Answer is:
To determine the variation of electric potential as a function of distance from the center of a uniformly charged solid sphere, we can analyze the behavior of electric potential both inside and outside the sphere. ### Step-by-Step Solution: 1. **Understanding Electric Potential Inside the Sphere**: - For a uniformly charged solid sphere of radius \( R \) and total charge \( Q \), the electric potential \( V \) at any point inside the sphere (at a distance \( r \) from the center, where \( r < R \)) is constant and equal to the potential at the surface of the sphere. - The formula for the electric potential at the surface is given by: \[ V = \frac{kQ}{R} \] - Therefore, for \( r < R \): \[ V = \frac{kQ}{R} \quad \text{(constant)} \] 2. **Understanding Electric Potential Outside the Sphere**: - For points outside the sphere (where \( r \geq R \)), the electric potential \( V \) behaves as if all the charge \( Q \) were concentrated at the center of the sphere. - The formula for the electric potential at a distance \( r \) from the center (where \( r \geq R \)) is: \[ V = \frac{kQ}{r} \] - This indicates that the potential decreases inversely with distance \( r \). 3. **Graphical Representation**: - From the above analysis, we can summarize the behavior of the electric potential: - Inside the sphere (\( r < R \)): The potential is constant at \( \frac{kQ}{R} \). - At the surface (\( r = R \)): The potential is \( \frac{kQ}{R} \). - Outside the sphere (\( r > R \)): The potential decreases as \( \frac{1}{r} \). - Therefore, the graph of electric potential \( V \) versus distance \( r \) will show: - A horizontal line at \( V = \frac{kQ}{R} \) for \( r < R \). - A hyperbolic decline for \( r \geq R \), approaching zero as \( r \) increases. 4. **Choosing the Correct Graph**: - Based on the described behavior, the correct graph will show: - A constant potential for \( r < R \). - A decreasing potential for \( r \geq R \) that approaches zero. - Thus, the graph that best represents this variation is option 2. ### Summary: - The electric potential is constant inside the sphere and decreases inversely with distance outside the sphere.
Promotional Banner

Topper's Solved these Questions

  • ELECTROSTATIC POTENTIAL AND CAPACITANCE

    AAKASH INSTITUTE|Exercise ASSIGNMENT SECTION - B|38 Videos
  • ELECTROSTATIC POTENTIAL AND CAPACITANCE

    AAKASH INSTITUTE|Exercise ASSIGNMENT SECTION - C|53 Videos
  • ELECTROSTATIC POTENTIAL AND CAPACITANCE

    AAKASH INSTITUTE|Exercise EXERCISE|20 Videos
  • ELECTROMAGNETIC WAVES

    AAKASH INSTITUTE|Exercise ASSIGNMENT SECTION - D Assertion-Reason Type Questions|25 Videos
  • GRAVITATION

    AAKASH INSTITUTE|Exercise ASSIGNMENT SECTION - D (ASSERTION-REASON TYPE QUESTIONS)|16 Videos

Similar Questions

Explore conceptually related problems

Flux (ph) as a function of distance (r) from centre of uniformly charged solid sphere of charge Q and radius R , is best represented by

Which one of the following graphs represents the variation of electric field with distance r from the centre of a charged spherical conductor of radius R?

The variation of electrostatic potential with radial distance r from centre of positively charged metallic thin shell of radius R is given by graph

Find the electric potential energy of a uniformly charged sphere.

AAKASH INSTITUTE-ELECTROSTATIC POTENTIAL AND CAPACITANCE -ASSIGNMENT SECTION - A
  1. Four charges of same magnitude q are placed at four corners of a squar...

    Text Solution

    |

  2. Two identical positive charges are placed at x=-a and x=a. The correct...

    Text Solution

    |

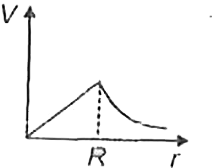
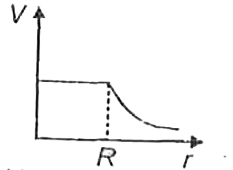
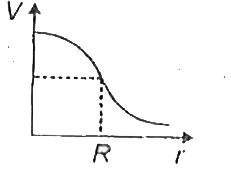
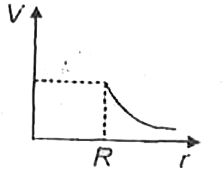
  3. Which graph best represents the variation of electric potential as a f...

    Text Solution

    |

  4. A hollow charged metal sphere has radius r. If the potential differenc...

    Text Solution

    |

  5. Two concentric hollow conducting spheres of radius r and R are shown. ...

    Text Solution

    |

  6. The potential gradient is a

    Text Solution

    |

  7. The electric potential V at any point x, y, z (all in meters) in space...

    Text Solution

    |

  8. Figure shows the variation of electric field intensity E versus distan...

    Text Solution

    |

  9. Figure shows a set of equipotential surfaces. The magnitude and direct...

    Text Solution

    |

  10. Determine the electric field strength vector if the potential of this ...

    Text Solution

    |

  11. If on the x - axis electric potential decreases uniform from 60 V to 2...

    Text Solution

    |

  12. An infinite sheet of charge has surface charge density sigma . The se...

    Text Solution

    |

  13. Two small spheres, each carrying a charge q are placed r m apart and t...

    Text Solution

    |

  14. Work done in moving a charge q coulomb on the surface of given charged...

    Text Solution

    |

  15. If an alpha particle and a proton are accelerated from rest by a poten...

    Text Solution

    |

  16. What will be electric potential at any point on the perpendicular bise...

    Text Solution

    |

  17. The work done in moving an electric charge q in an electric field does...

    Text Solution

    |

  18. A particle A has chrage +q and a particle B has charge +4q with each o...

    Text Solution

    |

  19. If 50 joule of work must be done to move an electric charge of 2 C fro...

    Text Solution

    |

  20. A proton has a mass 1.67 xx 10^(-27) kg and charge + 1.6 xx 10^(-19)C....

    Text Solution

    |