A
B
C
D
Text Solution
Verified by Experts
The correct Answer is:


Topper's Solved these Questions
Similar Questions
Explore conceptually related problems
ALLEN-BASIC MATHEMATICS USED IN PHYSICS &VECTORS -EXERCISE-IV ASSERTION & REASON
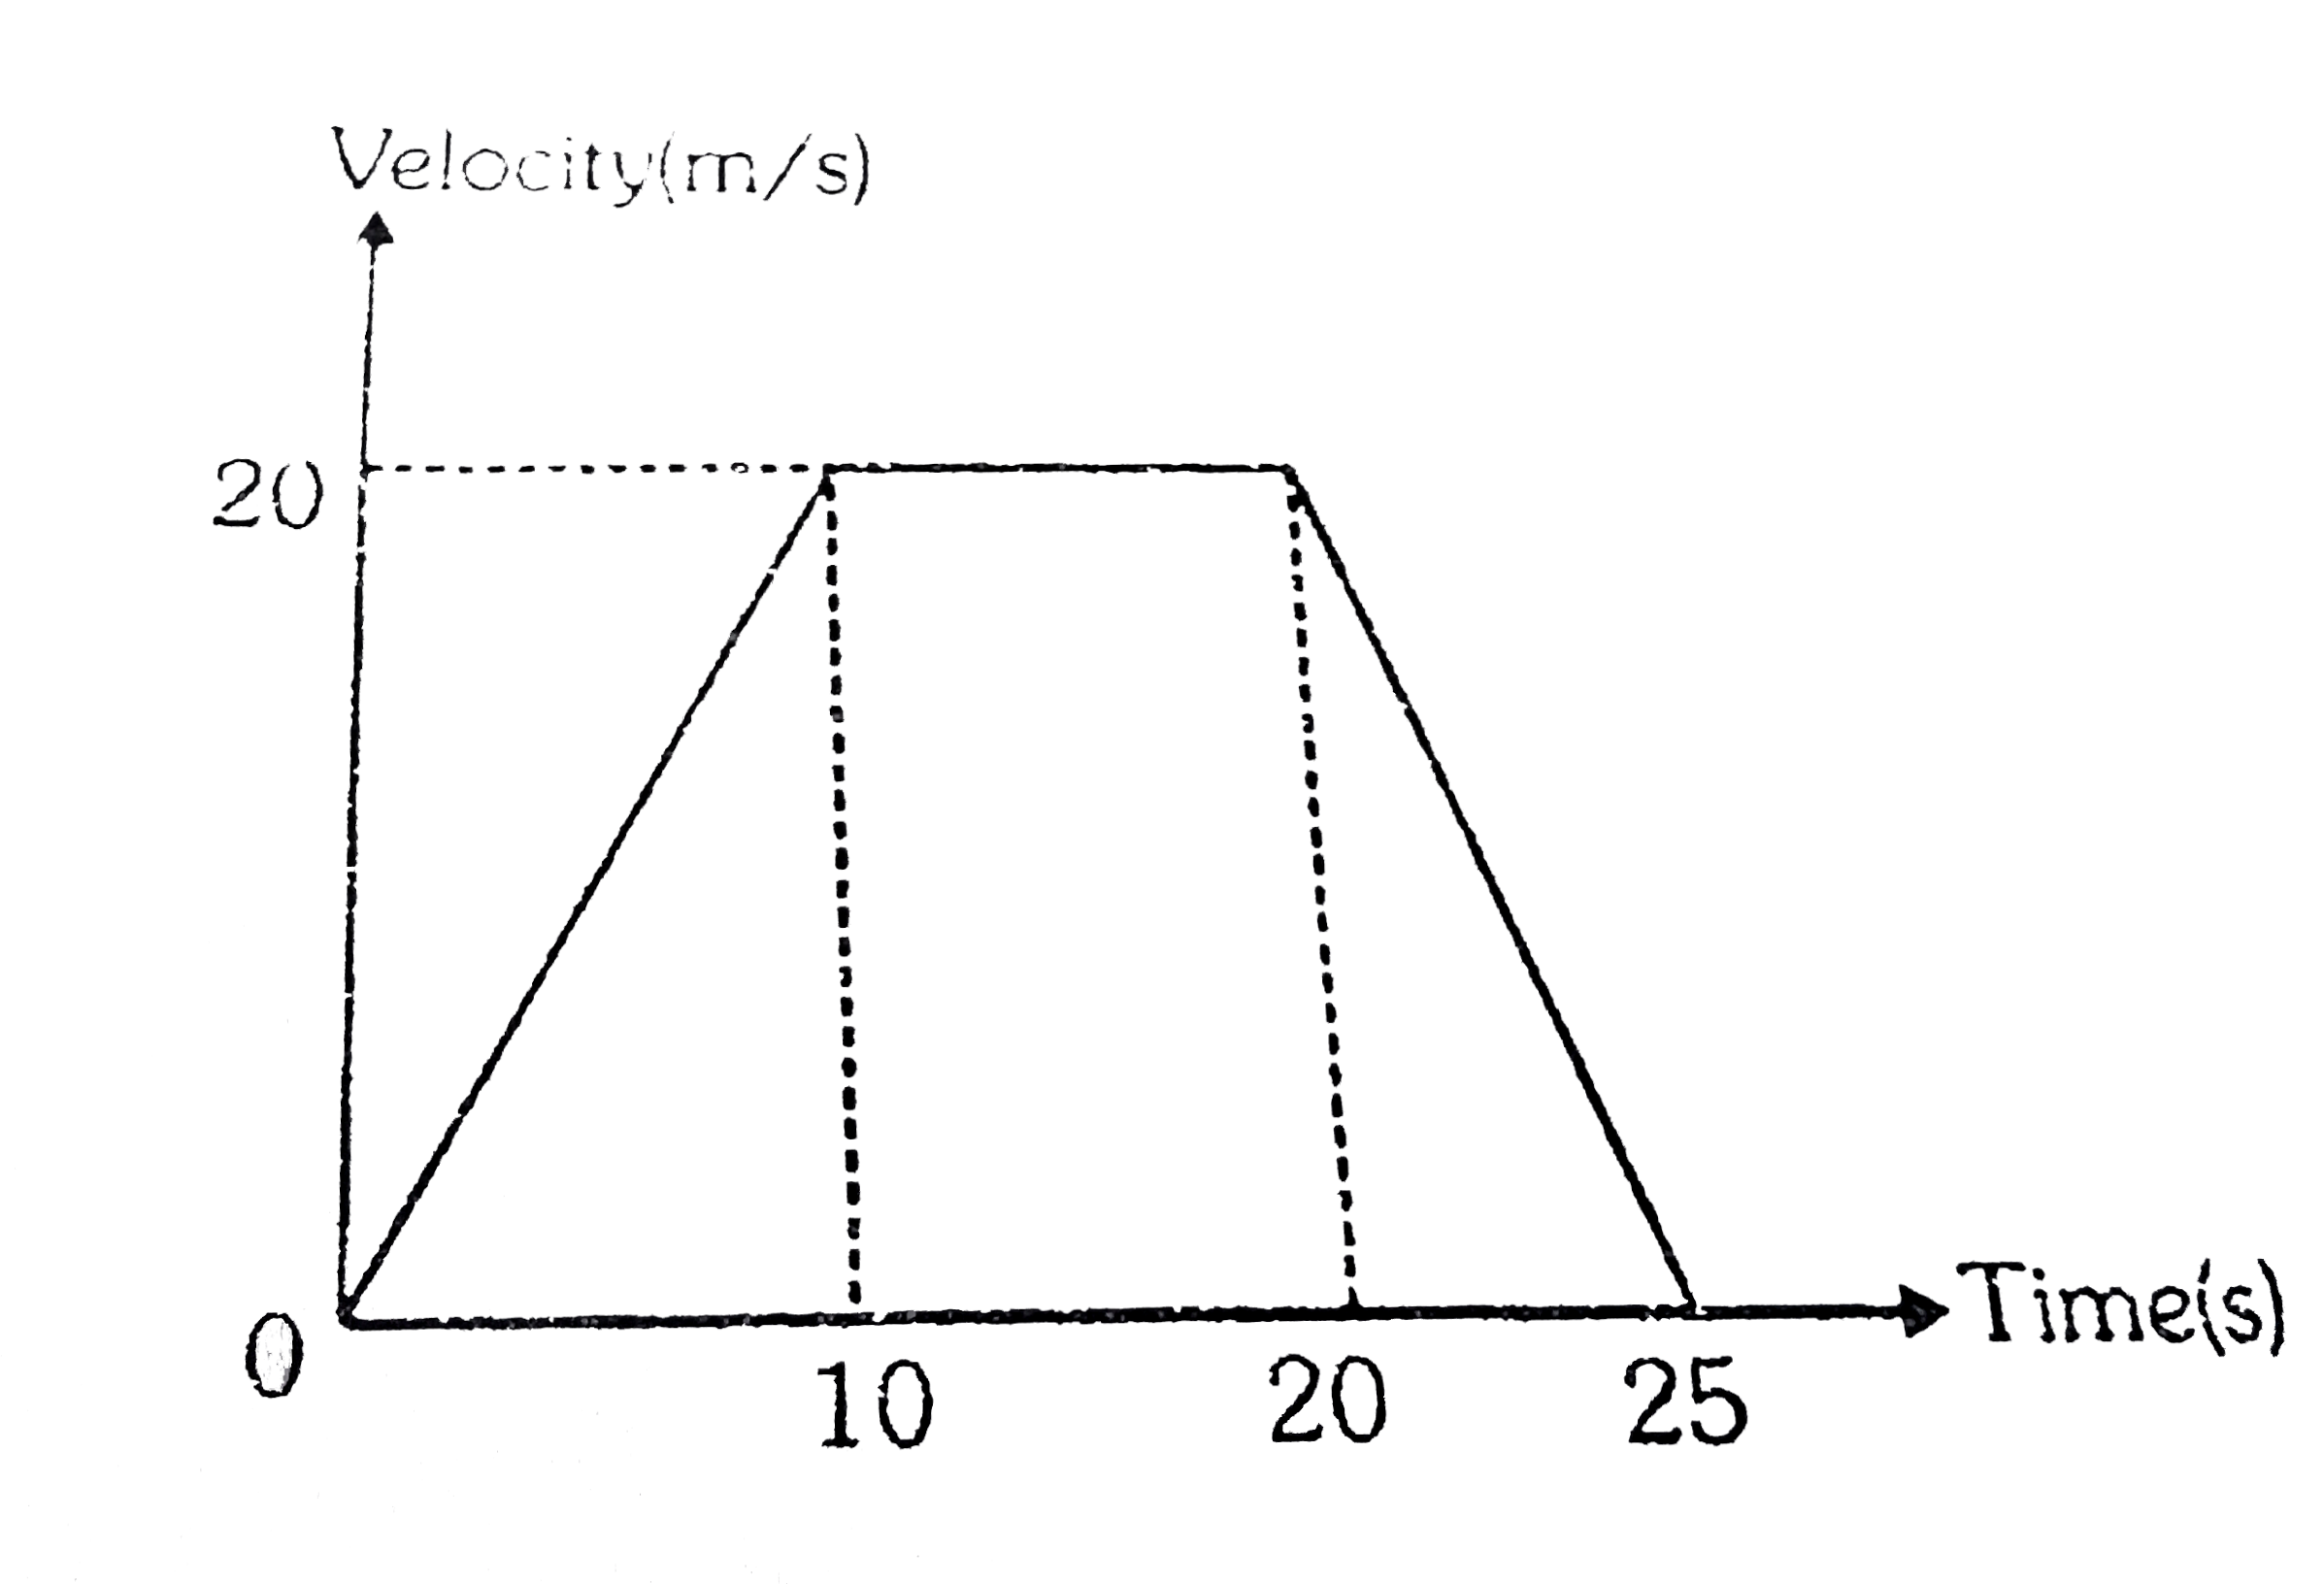
- The velocity-time graph of a car moving along a straight road is shown...
Text Solution
|
- Assertion : If the initial and final positions coincide, the displacem...
Text Solution
|
- Assertion : A vector quantity is a quantity that has both magnitude a...
Text Solution
|
- Assertion : The direction of a zero (null) vector is indeteminate. ...
Text Solution
|
- Assertion : A vector can have zero magnitude if one of its rectangular...
Text Solution
|
- Assertion : The angle between the two vectors (hati + hatj) and (hat...
Text Solution
|
- Assertion : Distance is a scalar quantity. Reason : Distance is the ...
Text Solution
|
- Assertion : The sum of squares of cosines of angles made by a vector ...
Text Solution
|
- Assertion : Adding a scalar to a vector of the same dimensions is a me...
Text Solution
|
- Assertion: The dot product of one vector with another vector may be sc...
Text Solution
|
- Statement-I : A physical quantity can be regarded as a vector, if magn...
Text Solution
|
- Assertion: Vecot (hati+hatj+hatk) is perpendicular to (hati-2hatj+hatk...
Text Solution
|