A
B
C
D
Text Solution
Verified by Experts
The correct Answer is:


Topper's Solved these Questions
STRUCTURE OF ATOM
NARAYNA|Exercise EXERCISE - I (C. W.) DE-BROGLIE.S & HEISENBERG.S UNCERTAINITY PRINCIPLE|4 VideosSTRUCTURE OF ATOM
NARAYNA|Exercise EXERCISE - I (C. W.) QUANTUM MECHANICAL MODEL OF ATOM|10 VideosSTRUCTURE OF ATOM
NARAYNA|Exercise EXERCISE - I (C. W.) HYDROGEN SPECTRUM|8 VideosSTATES OF MATTER
NARAYNA|Exercise A & R TYPE QUESTIONS|16 VideosTHERMODYNAMICS
NARAYNA|Exercise Assertion- Reason|5 Videos
Similar Questions
Explore conceptually related problems
NARAYNA-STRUCTURE OF ATOM-EXERCISE - I (C. W.) BOHR.S ATOMIC MODEL
- According to Bohr's theory, the angular momentum for an electron of 5t...
Text Solution
|
- The change in velocity when hydrogen electron jumps from K shell to L ...
Text Solution
|
- Each hydrogen atom is excited by giving 10.2eV. The maximum number of ...
Text Solution
|
- Consider the following statements (I) Bohr's theory can also be used...
Text Solution
|
- The ionisation potential of H-atom is 13.6eV. It is exposed to electro...
Text Solution
|
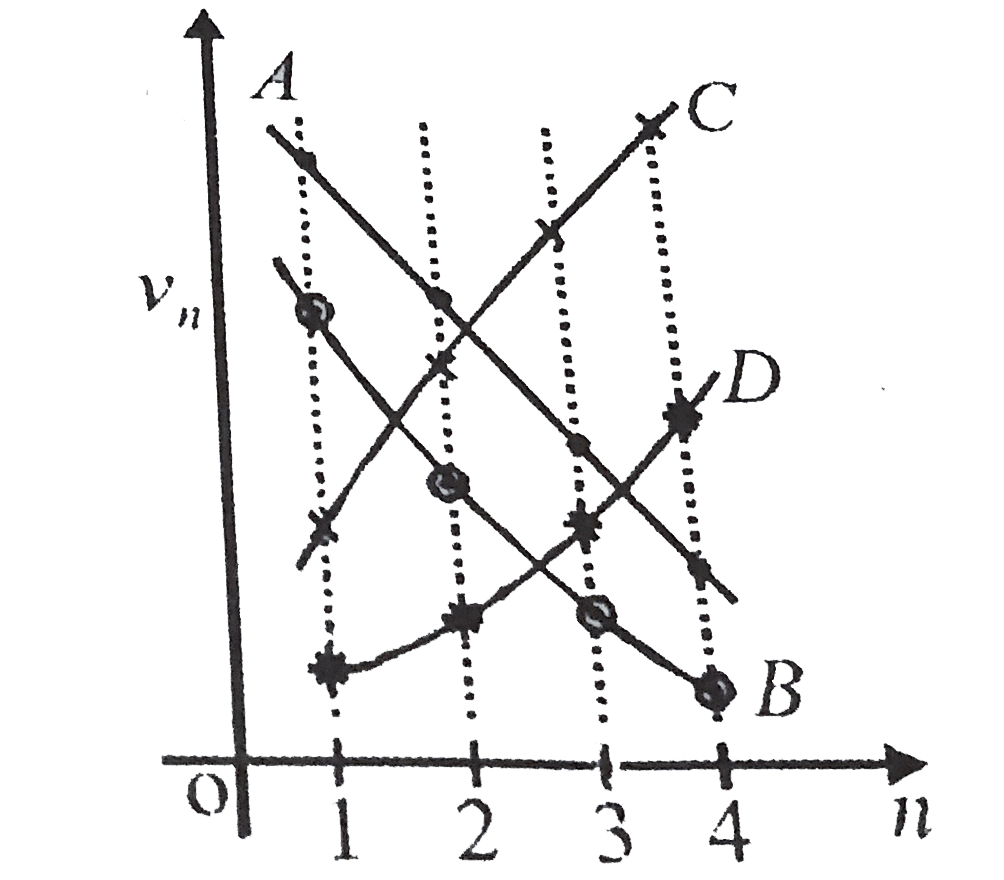
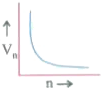
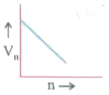
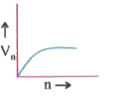
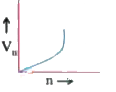
- Which of the plots shown in the figure represents speed (vn) of the el...
Text Solution
|
- The difference in angular momentum associated with the electron in two...
Text Solution
|
- Properties of electrons that are quantized in Bohr's atomic model are
Text Solution
|
- When greater number of excited hydrogen atoms reach the ground state, ...
Text Solution
|
- To which of the following is Bohr's theory applicable (I) He^(+) (II...
Text Solution
|