A
B
C
D
Text Solution
Verified by Experts
The correct Answer is:


Topper's Solved these Questions
SOLUTIONS & COLLIGATIVE PROPERTIES
NARAYNA|Exercise EXERCISE : 2 (C.W)|65 VideosSOLUTIONS & COLLIGATIVE PROPERTIES
NARAYNA|Exercise EXERCISE : 2 (H.W)|59 VideosSOLUTIONS & COLLIGATIVE PROPERTIES
NARAYNA|Exercise EXERCISE : 1 (C.W)|33 VideosSOLID STATES
NARAYNA|Exercise EXERCISE-4|18 VideosSURFACE CHEMISTRY
NARAYNA|Exercise EXERCISE - 4|22 Videos
Similar Questions
Explore conceptually related problems
NARAYNA-SOLUTIONS & COLLIGATIVE PROPERTIES -EXERCISE : 1 (H.W)
- I(2)+S(2)O(3)^(2-) to I^(-)+S(4)O(6)^(2-)
Text Solution
|
- The equvivalent weight of CH(4) in the reaction CH(4)+2O(2)to CO(2)+2H...
Text Solution
|
- M = molarity of the solution m = molality of the solution d = ...
Text Solution
|
- Molarity of 1m aqueous NaOH solution [density of the solution is 1.02 ...
Text Solution
|
- 0.1 gram mole of urea dissolved in 100 g of water. The molality of the...
Text Solution
|
- Density of 2.05 M solution of acetic acid in water is 1.02g//mL. The m...
Text Solution
|
- The mole fraction of solvent in 0.1 molal aqueous solution is
Text Solution
|
- A solution of 36% water and 64% acetaldehyde (CH(3)CHO) by mass. Mole...
Text Solution
|
- Incorrect statement is (K(H) = Henry's constant)
Text Solution
|
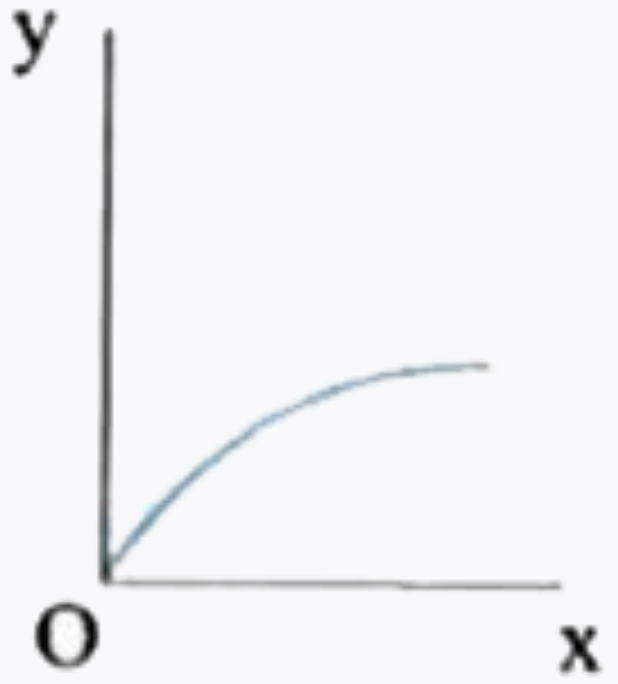
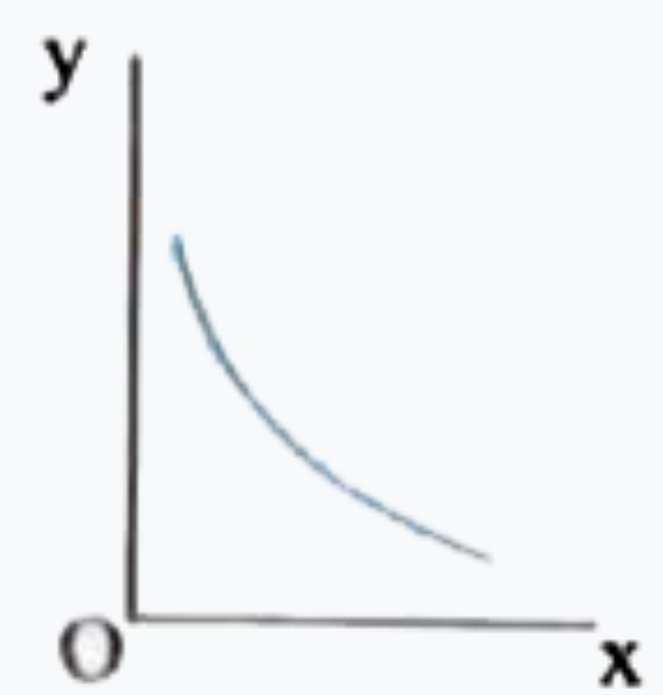
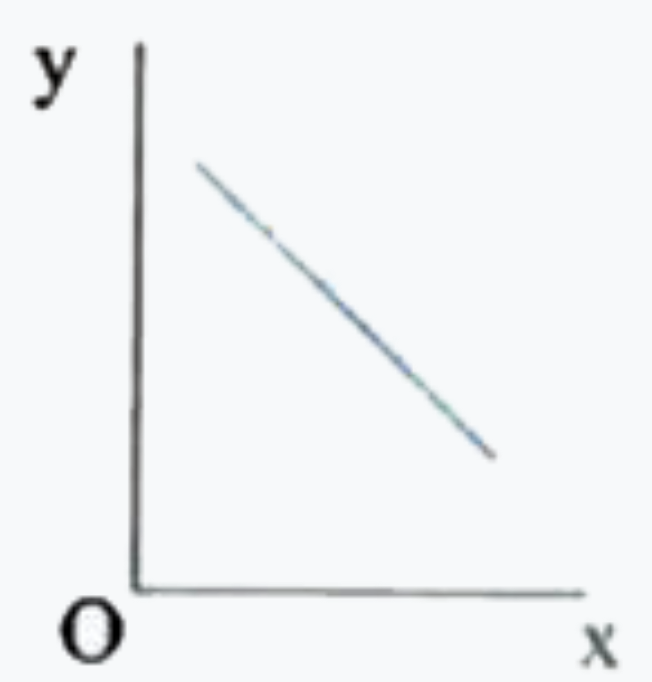
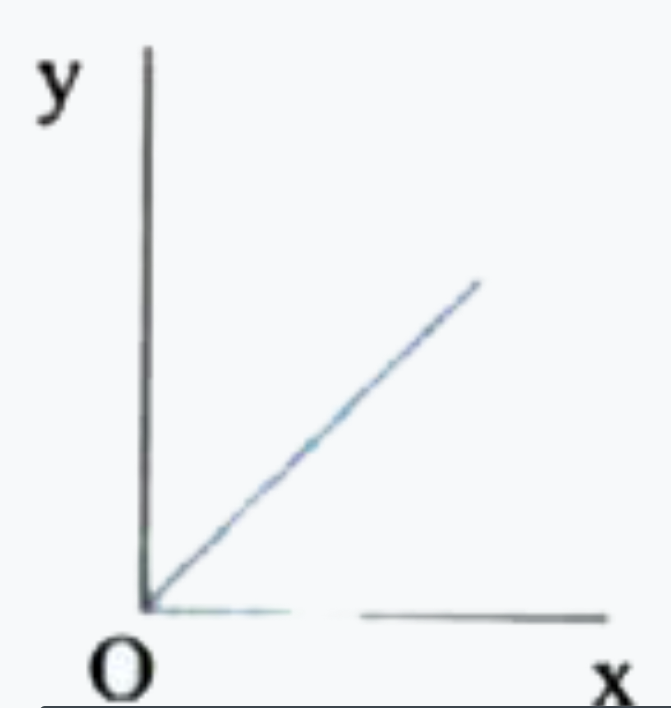
- Which of these curves represents Henry's law graph between partial pre...
Text Solution
|
- Which of the following solutions will have the maximum lowering of vap...
Text Solution
|
- The vapour pressure of water depends upon :
Text Solution
|
- Heptane and octane form an ideal solution. At 373 K, the vapour pressu...
Text Solution
|
- Choose the correct statement
Text Solution
|
- Isotonic solutions have :
Text Solution
|
- 0.1 M NaCl and 0.1 M CH(3)COOH are kept in separate containers. If the...
Text Solution
|
- Which one of the following statement is incorrect
Text Solution
|
- 18 g glucose and 6 g urea are dissolved in 1 L aqueous solution at 27^...
Text Solution
|
- A 5.25% solution of a substance is isotonic with a 1.5% solution of ur...
Text Solution
|
- 0.1 formal soluton of NaCl is found to be isotonic with 1.10% solution...
Text Solution
|