Home
Class 8
MATHS
The table given below shows the populati...

The table given below shows the population (in thousands) of men and women in a village in different years.

Draw two line graphs for the above data, using a suitable scale and answer the questions given below :
`(i)` Find the ratio of the male population and female population in the year `2013`.
`(ii)` Find the ratio of the total population of the village in `2015` to that in `2017`.
`(iii)` Find the percentage increase in the population of women in `2017` as compared to that in `2014`
`(iv)` Between which two years in the increase `%` in the number of men maximum?

Promotional Banner

Topper's Solved these Questions

  • LINE GRAPHS AND LINEAR GRAPHS

    RS AGGARWAL|Exercise Exercise 23|25 Videos
  • INTRODUCTION TO COORDINATE GEOMETRY

    RS AGGARWAL|Exercise EXERCISE B (OBJECTIVE QUESTIONS)|7 Videos
  • LINEAR EQUATIONS

    RS AGGARWAL|Exercise TEST PAPER-8 (D) (Write .T. for true and .F. for false for each of the following:)|1 Videos

Similar Questions

Explore conceptually related problems

Find the difference between Male population and Female population in the state WB ?

The female population of a village is 15392. The male population is 540 more than the female population. The total population of the village is

Average ratio of men and women in human population is :

Average female to male ratio in world population is

The bar graph given below represents the total propulation and male population (in 000) of a city, during the period of 2013 to 2016. What is the ratio of male and female population respectively in 2015?

Read the following pie-chart carefully and answer the questions given below: Population of two states in two years Total population in 2008 = 25 lacs Total population in 2009 = 28 lacs What is total population of Uttar Pradesh in 2008 and 2009 ?

Read the following pie-chart carefully and answer the questions given below: Population of two states in two years Total population in 2008 = 25 lacs Total population in 2009 = 28 lacs What is the respective ratio of population of Tamilnadu in 2008 to that of Maharashtra in 2009 ?

RS AGGARWAL-LINE GRAPHS AND LINEAR GRAPHS-Exercise 23
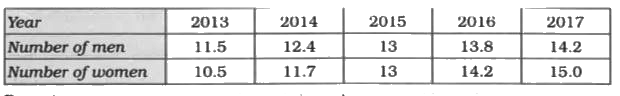
  1. The table given below shows the population (in thousands) of men and w...

    Text Solution

    |

  2. The following table depicts the maximum temperature on the seven days ...

    Text Solution

    |

  3. Consider the following input/output table. Draw a line graph for it. ...

    Text Solution

    |

  4. The table given below depicts the annual gross profit of a company for...

    Text Solution

    |

  5. Ajita starts off from home at 07.00 hours with her father on a scooter...

    Text Solution

    |

  6. The following table shows the percentage of students who dropped out o...

    Text Solution

    |

  7. The following chart gives the growth in height in terms of percentage ...

    Text Solution

    |

  8. A car is travelling from city P to city Q which are 350 km apart. The ...

    Text Solution

    |

  9. A courter-person cycles from a town to a neighbouring suburban area to...

    Text Solution

    |

  10. A man started his journey on his car from location A and came back. Th...

    Text Solution

    |

  11. The line graph given below shows the yearly sales figures for a manufa...

    Text Solution

    |

  12. The following is the distance -time graph of Amit's walking. Stud...

    Text Solution

    |

  13. For an experiment in botany, two different plants, plant A and B, were...

    Text Solution

    |

  14. The following line graph shows the change in temperature of a block of...

    Text Solution

    |

  15. The following line graph shows the temperature forecast and the actual...

    Text Solution

    |

  16. The following distance-time graph is for a car travelling to certain p...

    Text Solution

    |

  17. The following line graph shows the journey made by two cyclists, cycli...

    Text Solution

    |

  18. The following table gives the distances travelled by a car at various ...

    Text Solution

    |

  19. Study the table given below and draw a line graph for it. Is the ...

    Text Solution

    |

  20. Study the table given below and draw a line graph for it. Is the ...

    Text Solution

    |

  21. Plot a line graph for the variables p and q, where p is four times q i...

    Text Solution

    |