Home
Class 8
MATHS
For an experiment in botany, two differe...

For an experiment in botany, two different plants, plant A and B, were grown under similar laboratory conditions. Their heights were measured at the end of each week for three weeks. The results are shown by the line graph given below :

Study the above line graph carefully and answer the questions given below:
`(i)` How high was plant A after `(a) 2` weeks `(b) 3` weeks ?
`(ii)` How high was plant B after `(a) 2` weeks `(b) 3` weeks?
`(iii)` How much did plant A grow during the `3rd` week?
`(iv)` How much did plant B grow from the end of the `2nd` week to the end of the `3rd` week ?
`(v)` During which week did plant A grow most ?
`(vi)` During which week did plant B grow least ?
`(vii)` Were the two plants of the same height during any week shown here ? Specify.

Text Solution

Verified by Experts

The correct Answer is:
`(i) (a) 7cm` `(b) 9cm` `(ii) (a) 7cm` `(b) 10cm` `(iii) 2cm` `(iv) 3cm` `(v) 2nd` week `(vi)1st` week `(vii)` At the end of `2nd ` week
Promotional Banner

Topper's Solved these Questions

  • LINE GRAPHS AND LINEAR GRAPHS

    RS AGGARWAL|Exercise Exercise 23|25 Videos
  • INTRODUCTION TO COORDINATE GEOMETRY

    RS AGGARWAL|Exercise EXERCISE B (OBJECTIVE QUESTIONS)|7 Videos
  • LINEAR EQUATIONS

    RS AGGARWAL|Exercise TEST PAPER-8 (D) (Write .T. for true and .F. for false for each of the following:)|1 Videos

Similar Questions

Explore conceptually related problems

For an experiment in Botany, two different plants, plant A and plant B were grown under similar laboratory conditions. Their heights were measured at the end of each week for 3 weeks. The results are shown by the following graph. (a) How high was Plant A after (i) 2 weeks (ii) 3 weeks? (b) How high was Plant B after (i) 2 weeks (ii) 3 weeks? (c) How much did Plant A grow during the 3rd week? (d) How much did Plant B grow from the end of the 2nd week to the end of the 3rd week? (e) During which week did Plant A grow most? (f) During which week did Plant B grow least? (g) Were the two plants of the same height during any week shown here? Specify.

Study the following diagram carefully and select the correct statement given below for this plant :-

The following bar graph shows the games played by the students. Study the graph carefully and answer the question given below: How many students play table tennis?

Look at the bar graph given below: Study the bar graph carefully and answer the question given below: In which week was the production maximum ? What is the average production during these five weeks ? How many cycles were produced in the first 3 weeks ?

RS AGGARWAL-LINE GRAPHS AND LINEAR GRAPHS-Exercise 23
  1. The following chart gives the growth in height in terms of percentage ...

    Text Solution

    |

  2. A car is travelling from city P to city Q which are 350 km apart. The ...

    Text Solution

    |

  3. A courter-person cycles from a town to a neighbouring suburban area to...

    Text Solution

    |

  4. A man started his journey on his car from location A and came back. Th...

    Text Solution

    |

  5. The line graph given below shows the yearly sales figures for a manufa...

    Text Solution

    |

  6. The following is the distance -time graph of Amit's walking. Stud...

    Text Solution

    |

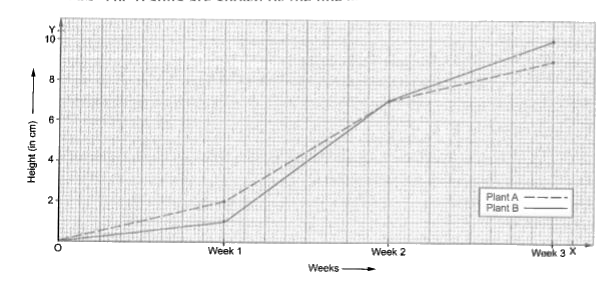
  7. For an experiment in botany, two different plants, plant A and B, were...

    Text Solution

    |

  8. The following line graph shows the change in temperature of a block of...

    Text Solution

    |

  9. The following line graph shows the temperature forecast and the actual...

    Text Solution

    |

  10. The following distance-time graph is for a car travelling to certain p...

    Text Solution

    |

  11. The following line graph shows the journey made by two cyclists, cycli...

    Text Solution

    |

  12. The following table gives the distances travelled by a car at various ...

    Text Solution

    |

  13. Study the table given below and draw a line graph for it. Is the ...

    Text Solution

    |

  14. Study the table given below and draw a line graph for it. Is the ...

    Text Solution

    |

  15. Plot a line graph for the variables p and q, where p is four times q i...

    Text Solution

    |

  16. Plot a line graph for the variables x and y , where y=2x+1 . Further...

    Text Solution

    |

  17. (Principal and Simple Interest) A bank gives 10% Simple Interest (S...

    Text Solution

    |

  18. (Time and Distance) Ajit can ride a scooter constantly at a speed of 3...

    Text Solution

    |

  19. Explain the situations represented by the following distance-time grap...

    Text Solution

    |

  20. Can there be a temperature- time graph as follows ? Justify your answe...

    Text Solution

    |