


Similar Questions
Explore conceptually related problems
Recommended Questions
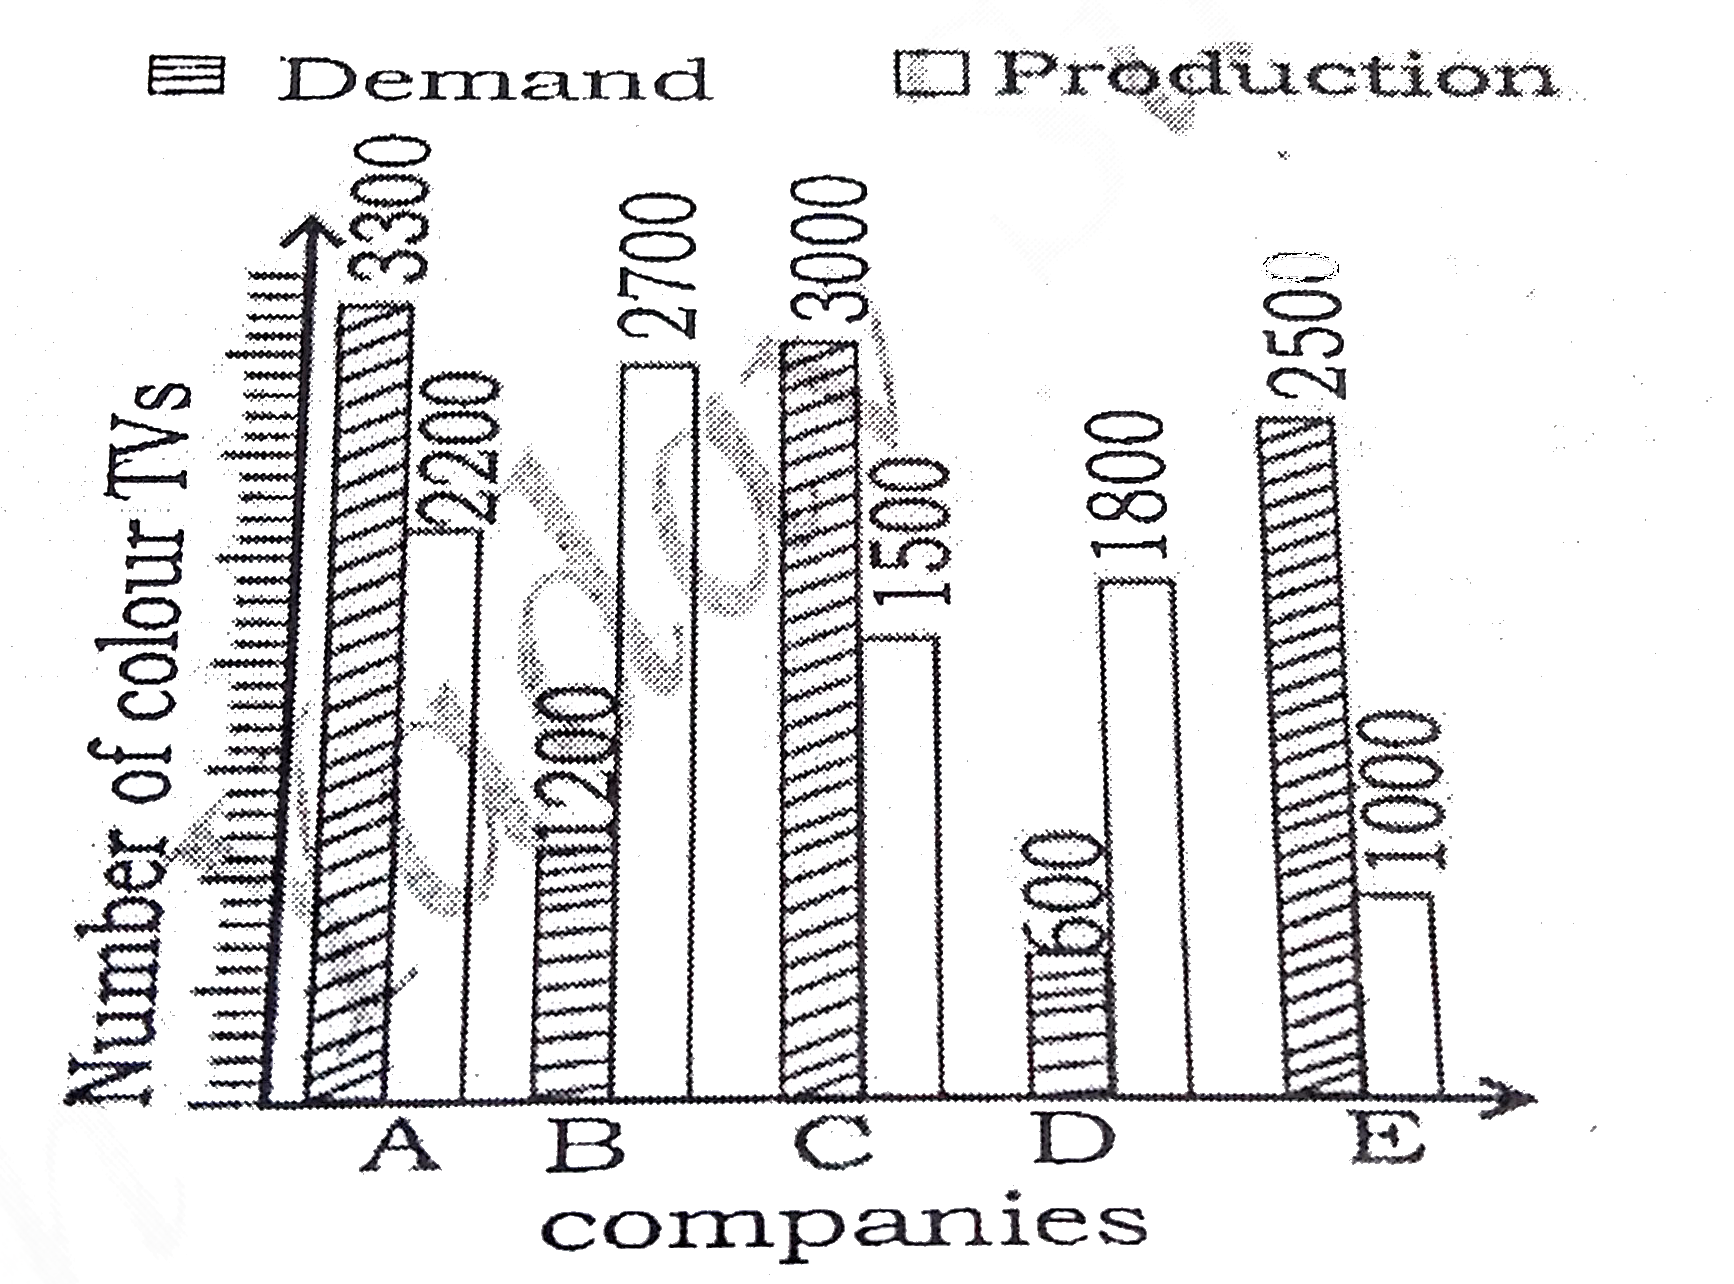
- Study the bar diagram and answer the following questions Demand and pr...
Text Solution
|
- Study the bar diagram and answer the following questions Demand and pr...
Text Solution
|
- Study the bar diagram and answer the following questions Demand and pr...
Text Solution
|
- Study the bar diagram and answer the following questions Demand and pr...
Text Solution
|
- Study the bar diagram and answer the following questions Demand and pr...
Text Solution
|
- Match the following Column A to Column B
Text Solution
|
- Study the following bar graph and answer the question given. निम्नलि...
Text Solution
|
- The given Bar graph presents the Demand and Production of motorcycles ...
Text Solution
|
- The given Bar graph presents the Demand and Production of motorcycles ...
Text Solution
|