


Similar Questions
Explore conceptually related problems
Recommended Questions
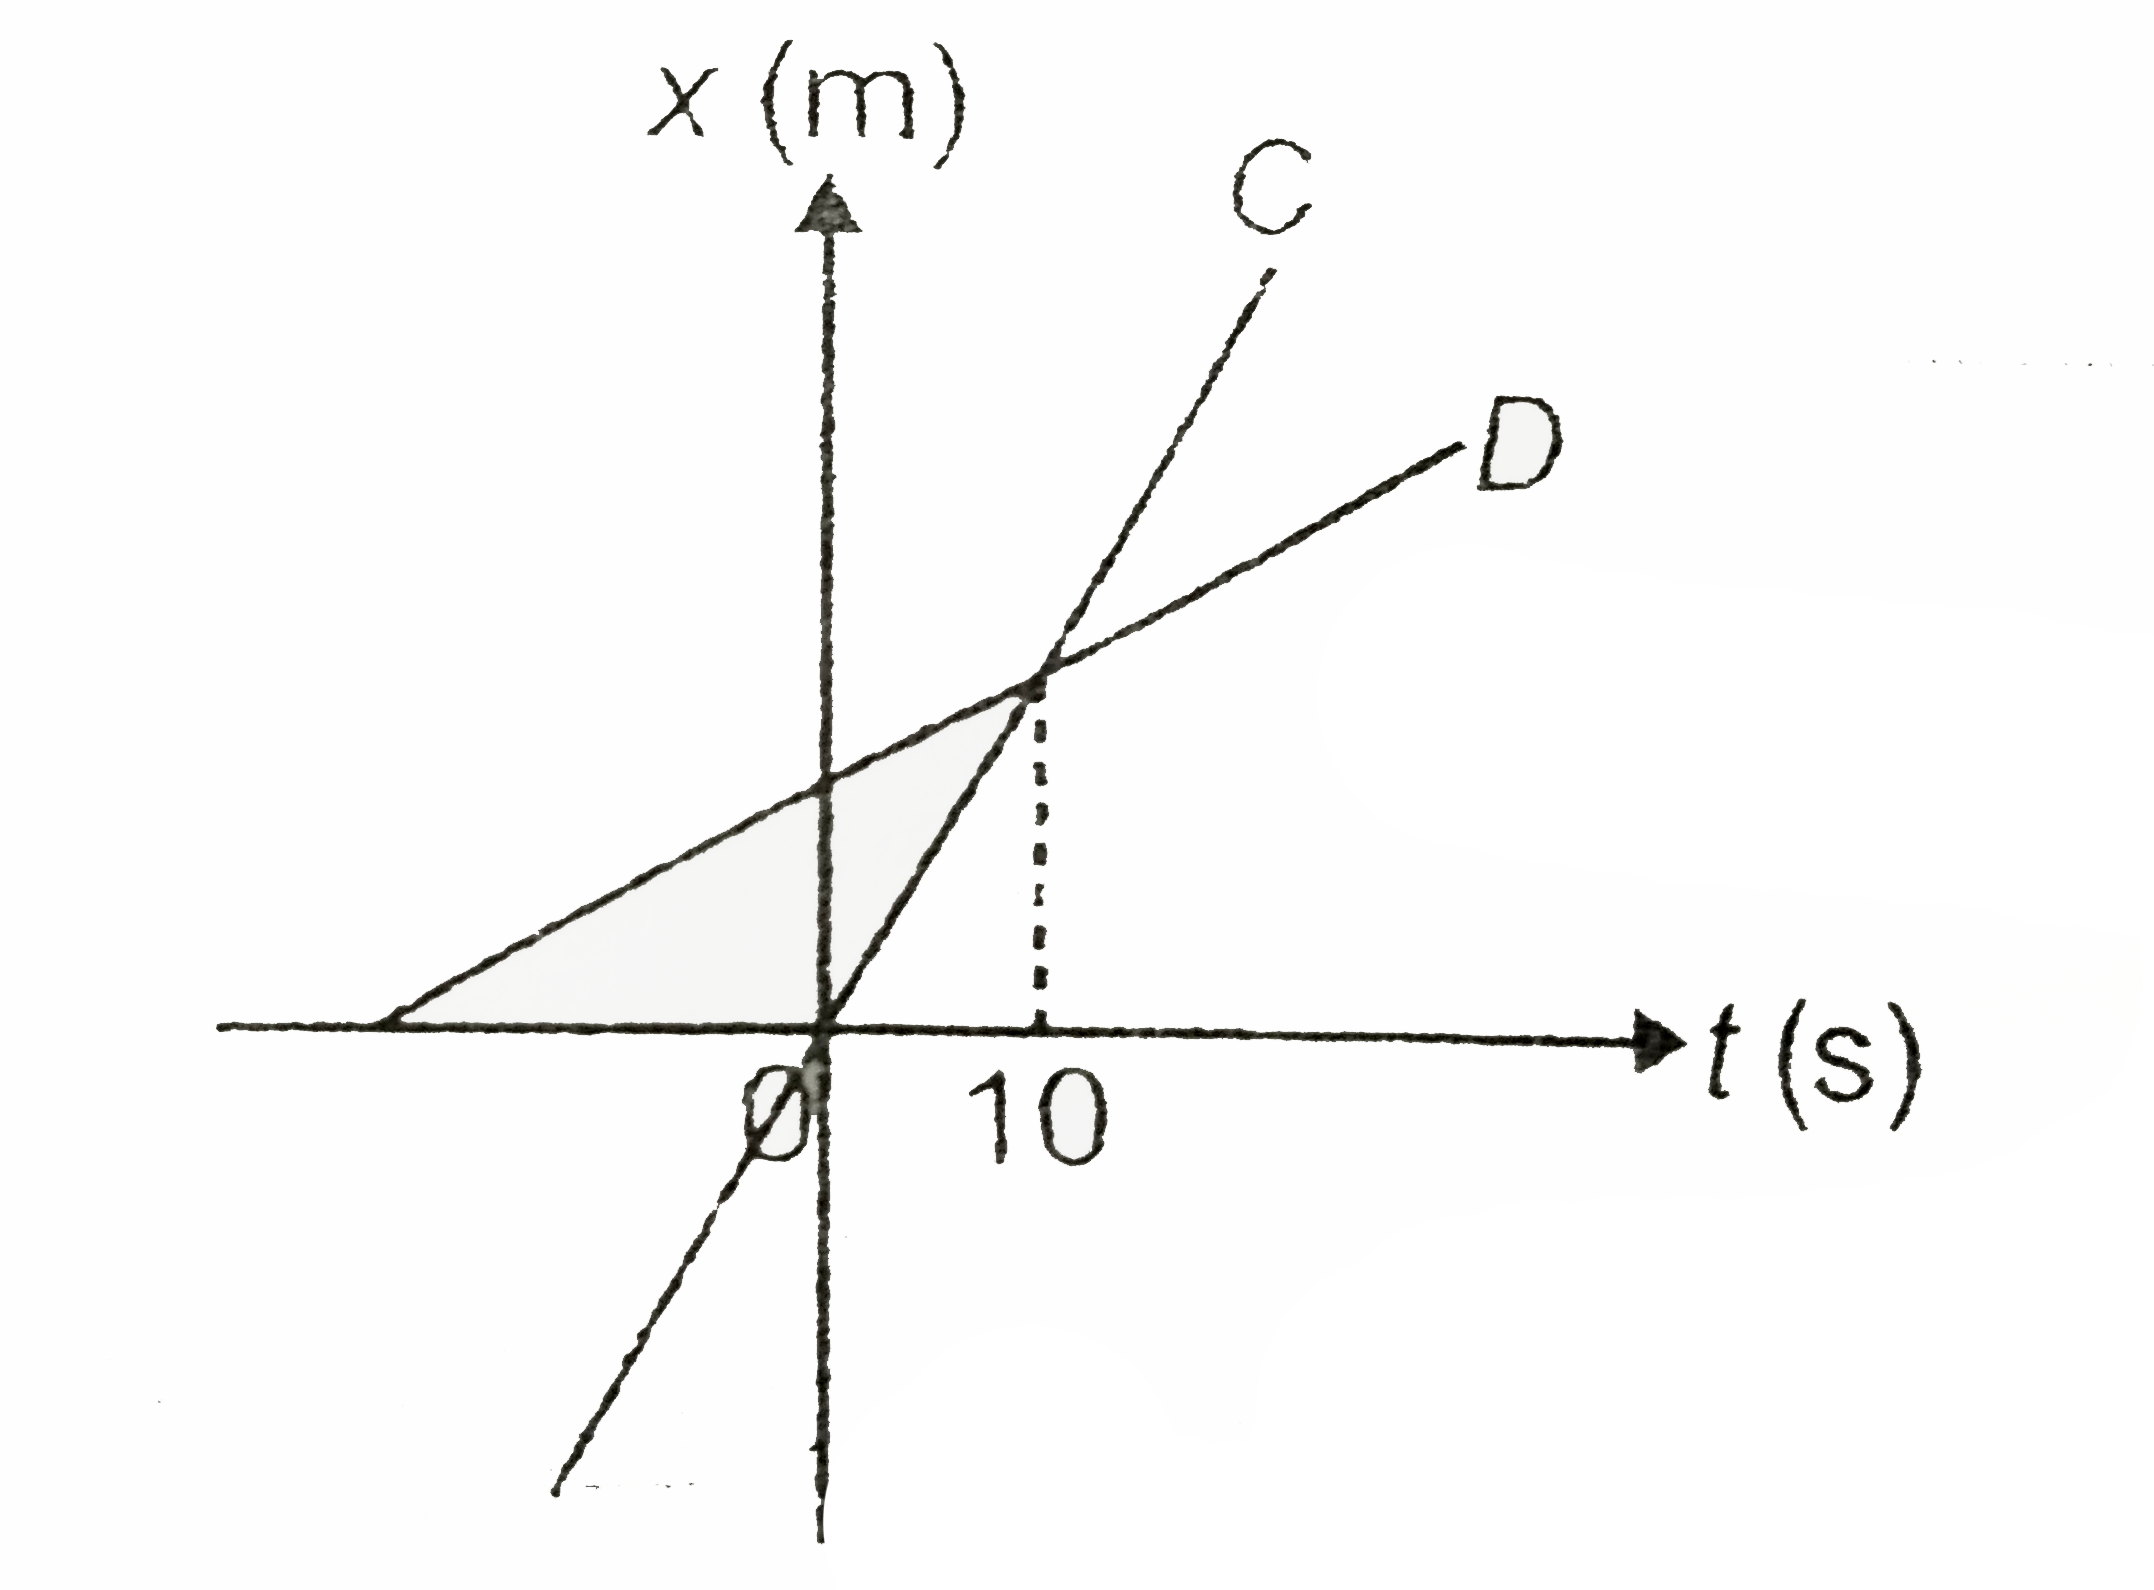
- The figure shows position time graph of two riders C and D. Based on t...
Text Solution
|
- The figure shows position time graph of two riders C and D. Based on t...
Text Solution
|
- The figure shows position time graph of two riders C and D. Based on t...
Text Solution
|
- The figure shows position time graph of two riders C and D. Based on t...
Text Solution
|
- The figure shows position time graph of two riders C and D. Based on t...
Text Solution
|
- चित्र 3.24 में एक साइकिल सवार का स्थिति - समय ग्राफ दिया गया है । इस ग...
Text Solution
|
- चित्र 3.24 में एक साइकिल सवार का स्थिति - समय ग्राफ दिया गया है । इस ग...
Text Solution
|
- The figure shows the effect of light on the rate of photosynthesis. Ba...
Text Solution
|
- Figure shows the position-time graph of a particle of mass 4 kg. What ...
Text Solution
|