


Similar Questions
Explore conceptually related problems
Recommended Questions
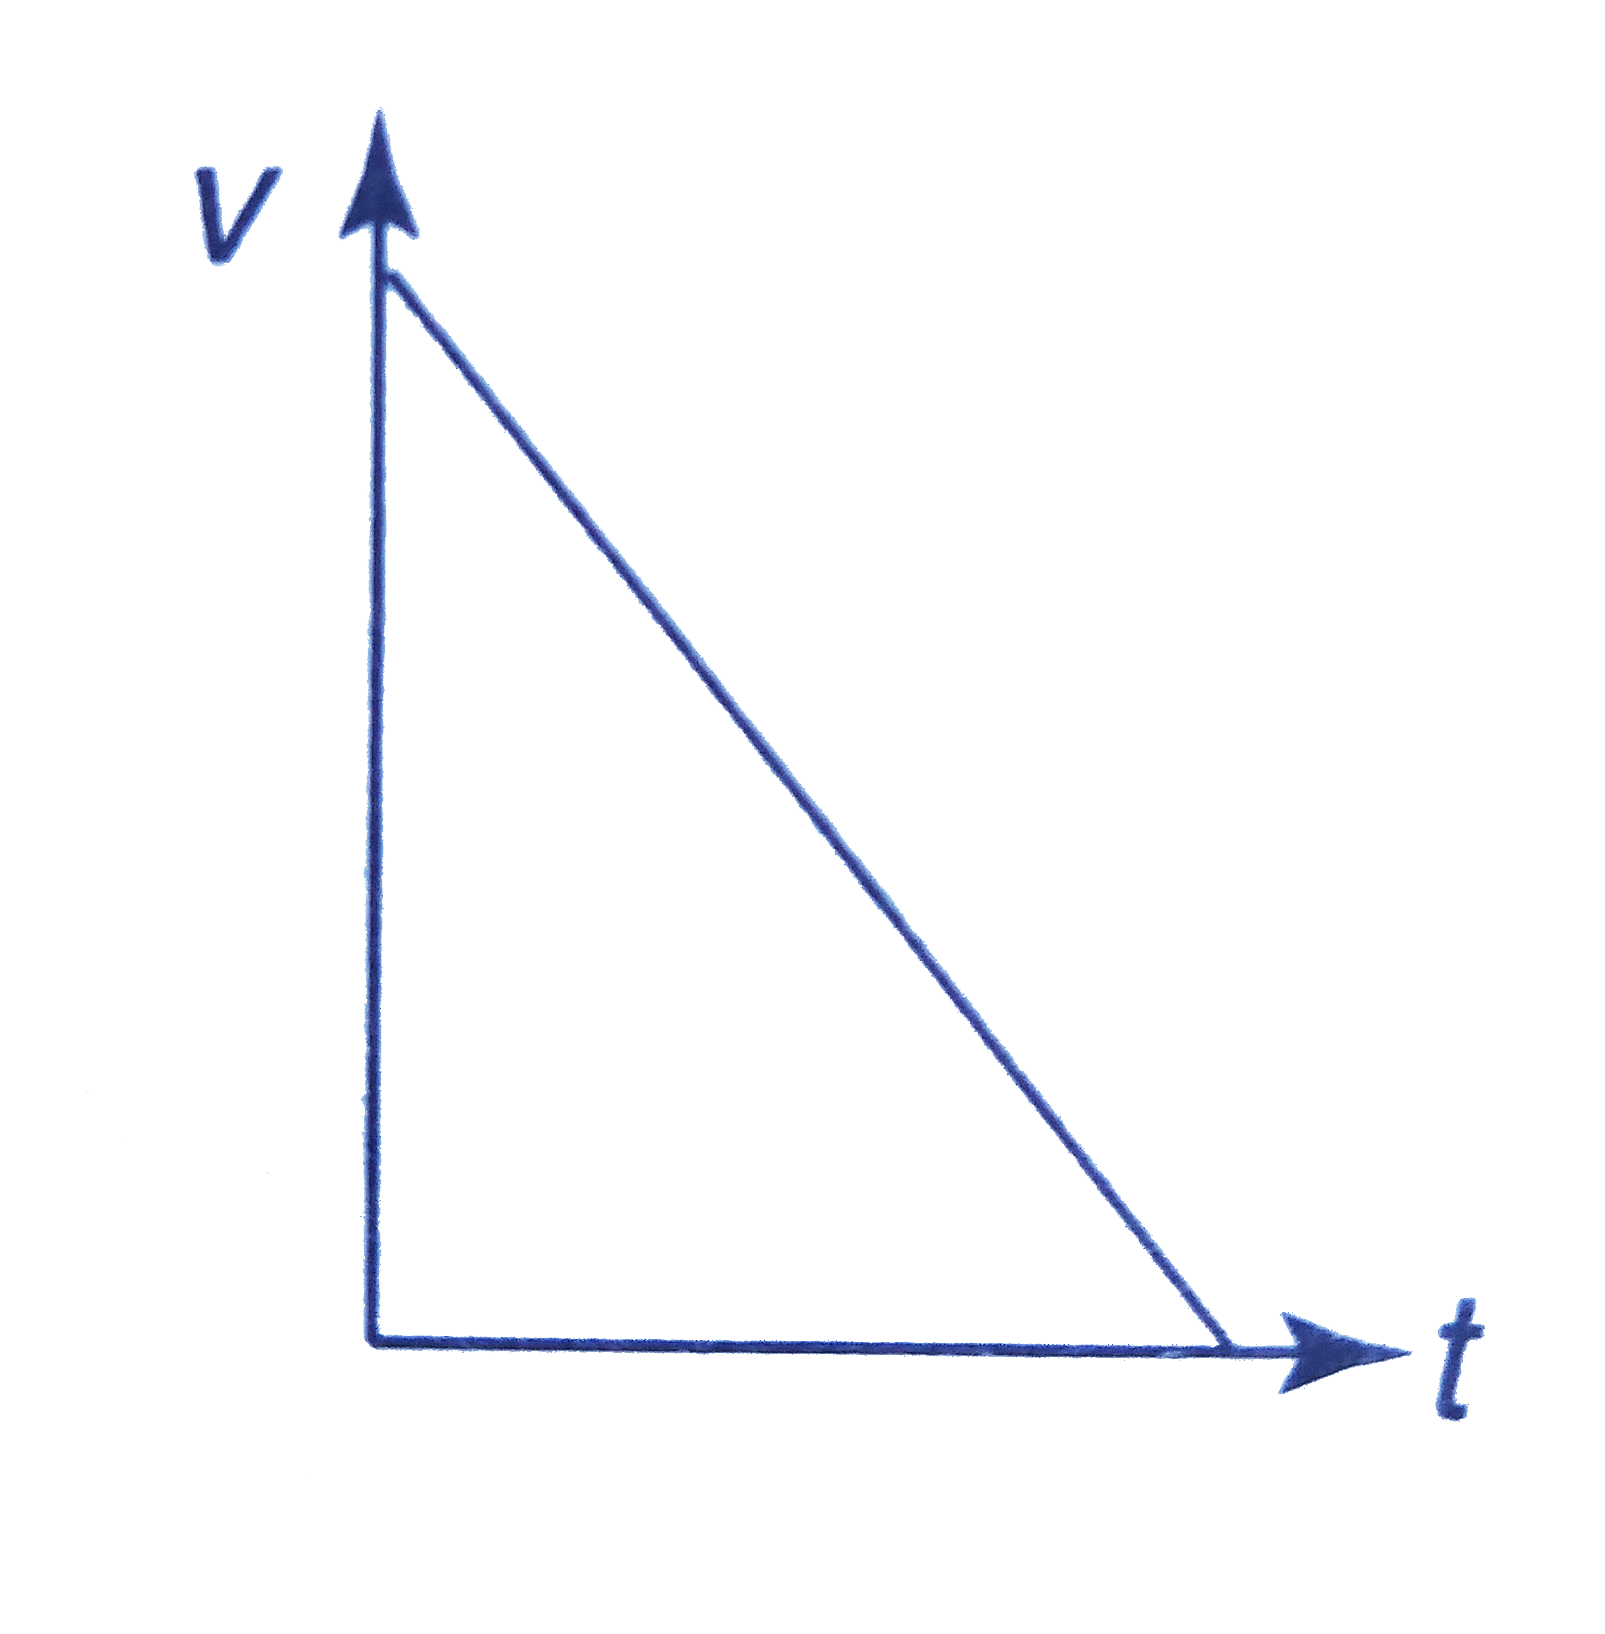
- Figure gives the velocity-time graph. This shows that the body is.
Text Solution
|
- Figure gives the velocity-time graph. This shows that the body is.
Text Solution
|
- Figure shows a velocity-time graph. This shows that.
Text Solution
|
- Figure shows the displacement tiime (x-t) graph of a body moving in a ...
Text Solution
|
- The following figure-1.105 shows the velocity-time graph ofa body. Acc...
Text Solution
|
- The following figure-1.114 shows the linear motion velocity-time graph...
Text Solution
|
- The following figure shows the velocity time graph of a body. Accordin...
Text Solution
|
- चित्र 3.41 में किसी पिण्ड का वेग-समय ग्राफ प्रदर्शित है इसकी सहायता से...
Text Solution
|
- चित्र 3.41 में किसी पिण्ड का वेग-समय ग्राफ प्रदर्शित है इसकी सहायता से...
Text Solution
|