


Similar Questions
Explore conceptually related problems
Recommended Questions
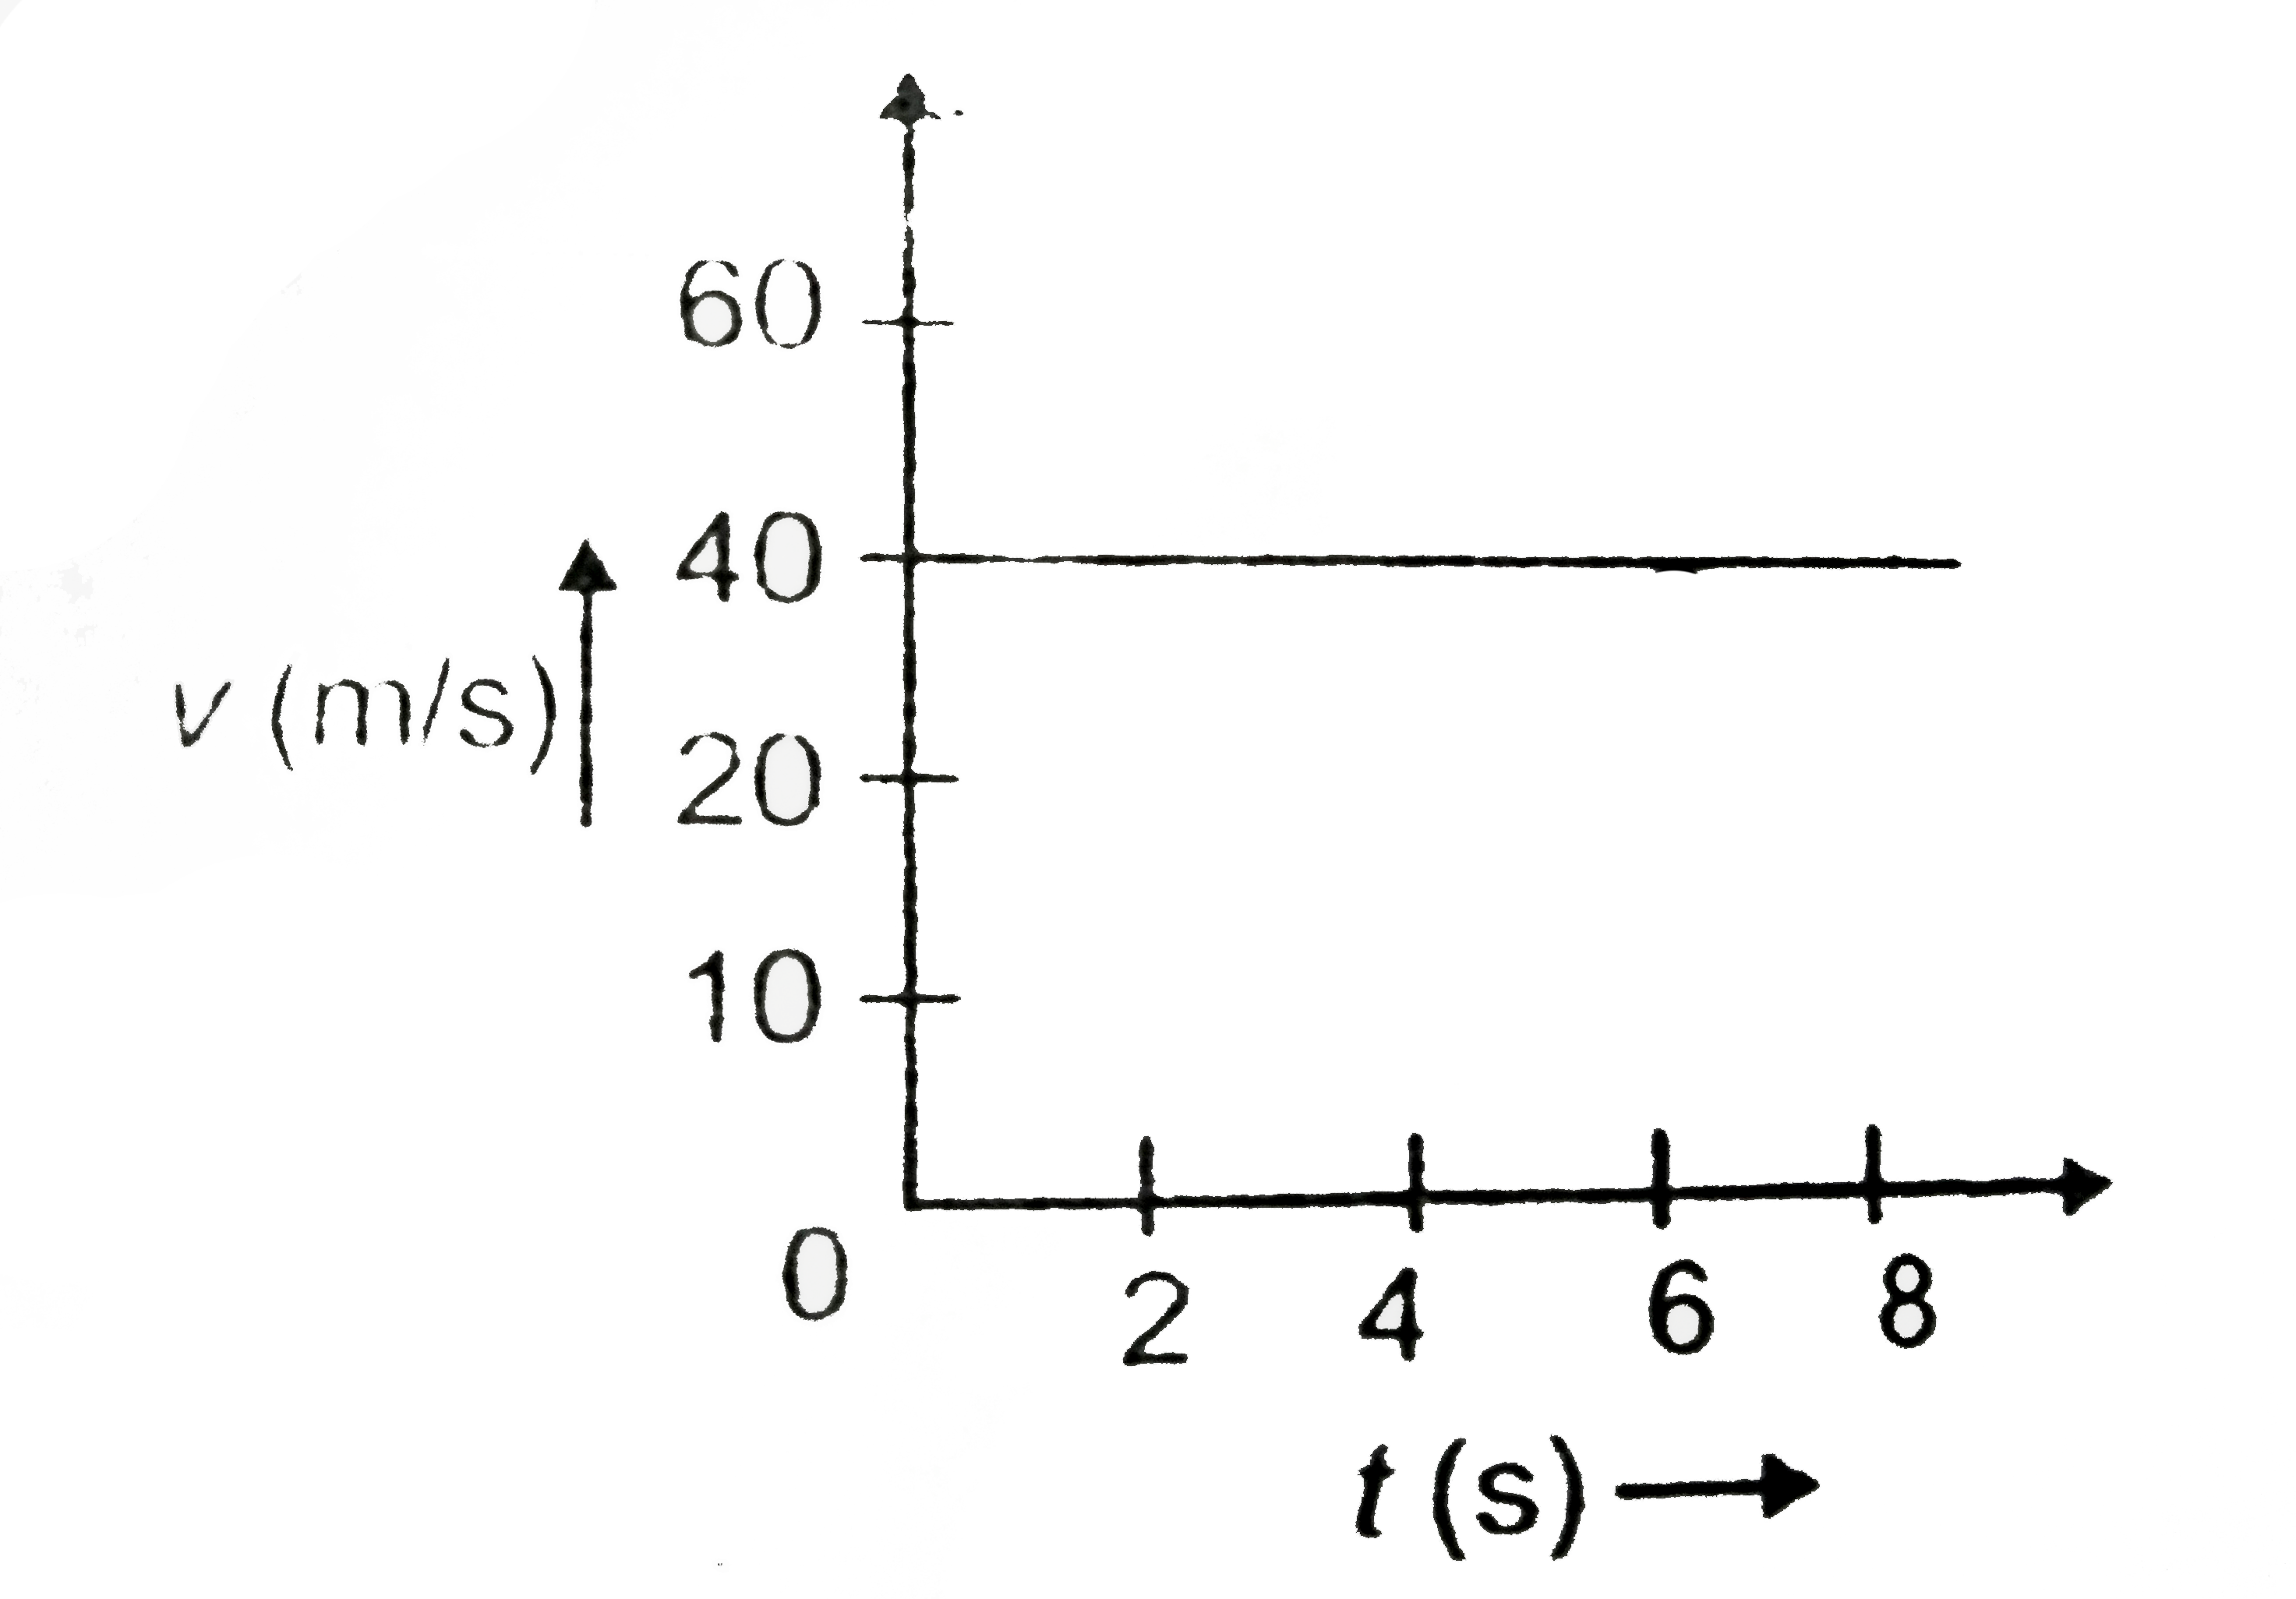
- The velocity-time graph of an object is shown below. The acceleration ...
Text Solution
|
- The graph shown the variation with times t of the velocity v of an obj...
Text Solution
|
- The position-time graph of an object is given below. What is the veloc...
Text Solution
|
- The velocity-time graph of an object is given below. Calculate the ave...
Text Solution
|
- The velocity-time graph of an object is shown below. The part of the g...
Text Solution
|
- The velocity-time graph of an object is shown below. The acceleration ...
Text Solution
|
- The position - time graph of an object is given below. What is the vel...
Text Solution
|
- चित्र में किसी वस्तु के लिए त्वरण-समय ग्राफ प्रदर्शित किया गया है। इसी...
Text Solution
|
- Velocity - time graph of a moving object is shown below. What is the a...
Text Solution
|