


Similar Questions
Explore conceptually related problems
Recommended Questions
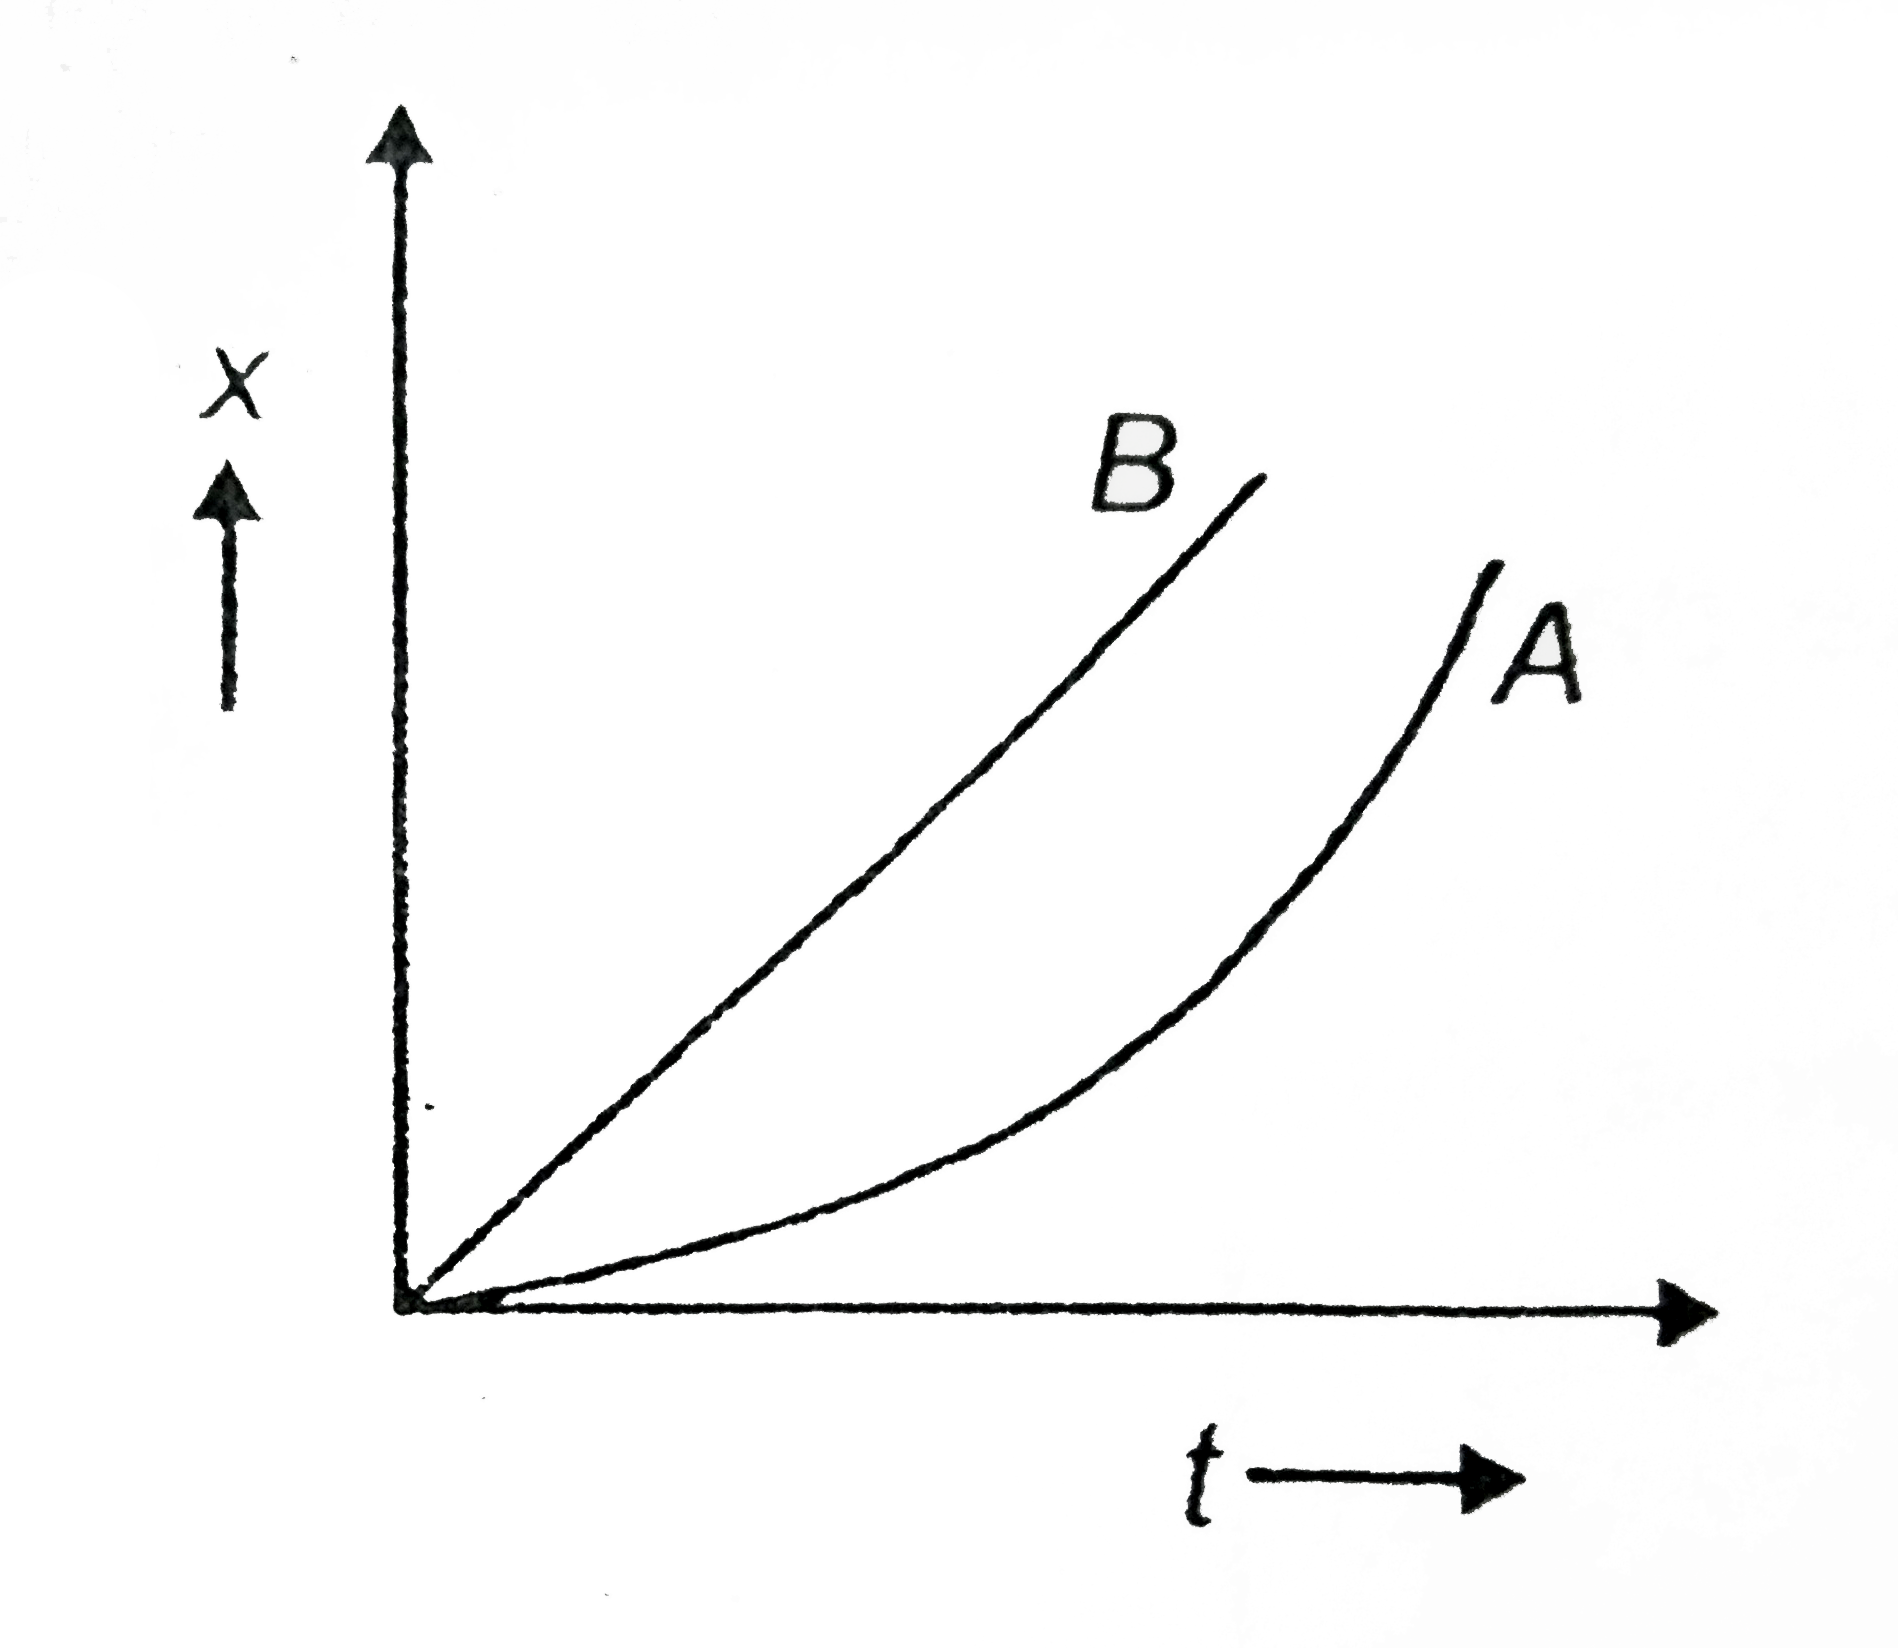
- The displacement-time graph of two moving objects A and B are shown in...
Text Solution
|
- Which one of the following represents displacement-time graph of two o...
Text Solution
|
- The displacement-time graph of two moving objects A and B are shown in...
Text Solution
|
- The velocity-time graph of a particle moving along a straight line is ...
Text Solution
|
- The displacement-time of a moving object is shown in figure. Which of ...
Text Solution
|
- The velocity - time graph of a particle moving along a straight line i...
Text Solution
|
- Velocity - time graph of a moving object is shown below. What is the a...
Text Solution
|
- दो वस्तुएँ A तथा B गतिशील है। इन दोनों वस्तुओं का दूरी - समय ग्राफ ब...
Text Solution
|
- किसी गतिशील वस्तु का वेग-समय ग्राफ चित्र में दर्शाया गया है। उस समयान्...
Text Solution
|