Home
Class 9
MATHS
Draw a frequency curve for the data give...

Draw a frequency curve for the data given below:
`{:("Class Interval",0-10,10-20,20-30,30-40,40-50,50-60,60-70),("Frequency",3,2,4,6,9,7,10):}`

Text Solution

Verified by Experts

Following table shows the mid-values of classes and corresponding frequencies for the given data:
`{:("Class Interval","Mid-value","Frequency"),(" "0-10," "5," "3),(" "10-20," "15," "2),(" "20-30," "25," "4),(" "30-40," "35," "6),(" "40-50," "45," "9),(" "50-60," "55," "7),(" "60-70," "65," "10):}`
Now, taking the mid-values of the classes along the X-axis and the corresponding frequencies along the Y-axis, we mark the points obtained from the above table in a graph sheet and join them with a smooth curve, which gives the frequency curve as shown in the Fig. 9.4.
Promotional Banner

Topper's Solved these Questions

  • STATISTICS

    PEARSON IIT JEE FOUNDATION|Exercise VERY SHORT ANSWER TYPE QUESTIONS|30 Videos
  • STATISTICS

    PEARSON IIT JEE FOUNDATION|Exercise SHORT ANSWER TYPE QUESTIONS|14 Videos
  • SIMPLE INTEREST AND COMPOUND INTEREST

    PEARSON IIT JEE FOUNDATION|Exercise CONCEPT APPLICATION|1 Videos
  • TRIGONOMETRY

    PEARSON IIT JEE FOUNDATION|Exercise Level 3|15 Videos

Similar Questions

Explore conceptually related problems

For the given distribution, draw the less than and greater than cumulative frequency curves. {:("Class Interval",0-10,10-20,20-30,30-40,40-50,50-60,60-70,70-80),("Frequency",5,3,7,2,14,9,15,10):}

The mode from given grouped data would be {:("Class Interval",10-20,20-30,30-40,40-50,50-60),("Frequency",5,7,6,8,4):}

Construct a histogram for the frequency distribution below: {:("Class Interval",10-20,20-30,30-40,40-50,50-60),("Frequency",6,3,8,4,7):}

Estimate the mode of the following data from the histogram. {:("Class Interval",0-10,10-20,20-30,30-40,40-50,50-60,60-70,70-80),("Frequency",8,10,15,16,20,13,14,12):}

Given data shows marks of 32 students in an examination. Mean of the marks will be {:("Class interval",0-10,10-20,20-30,30-40,40-50),("Frequency",12,6,8,4,2):}

Calculate mode from the following data : {:("Class Interval",0-10,10-20,20-30,30-40,40-50),("Frequency"," "2," "5," "7," "5," "2):}

Find out the arithmetic mean by the Step-deviation Method of the following: {:("Class Interval",0-10,10-20,20-30,30-40,40-50,50-60,60-70,70-80),("Frequency "," "12," "16," "32," "52," "42," "32," "18," "12):}

For the following frequency distribution draw a cumulative frequency curve of "'more than type'" and hence obtain the median value [["Class",0-10,10-20,20-30,30-40,40-50,50-60,60-70],["Frequency",5,15,20,23,17,11,9]]

Find the missing frequency of the group 20-30 when the median is 28. {:("Class Interval",0-10,10-20,20-30,30-40,40-50),("Frequency"," "5," "8," "?," "16," "6):}

PEARSON IIT JEE FOUNDATION-STATISTICS-LEVEL-3
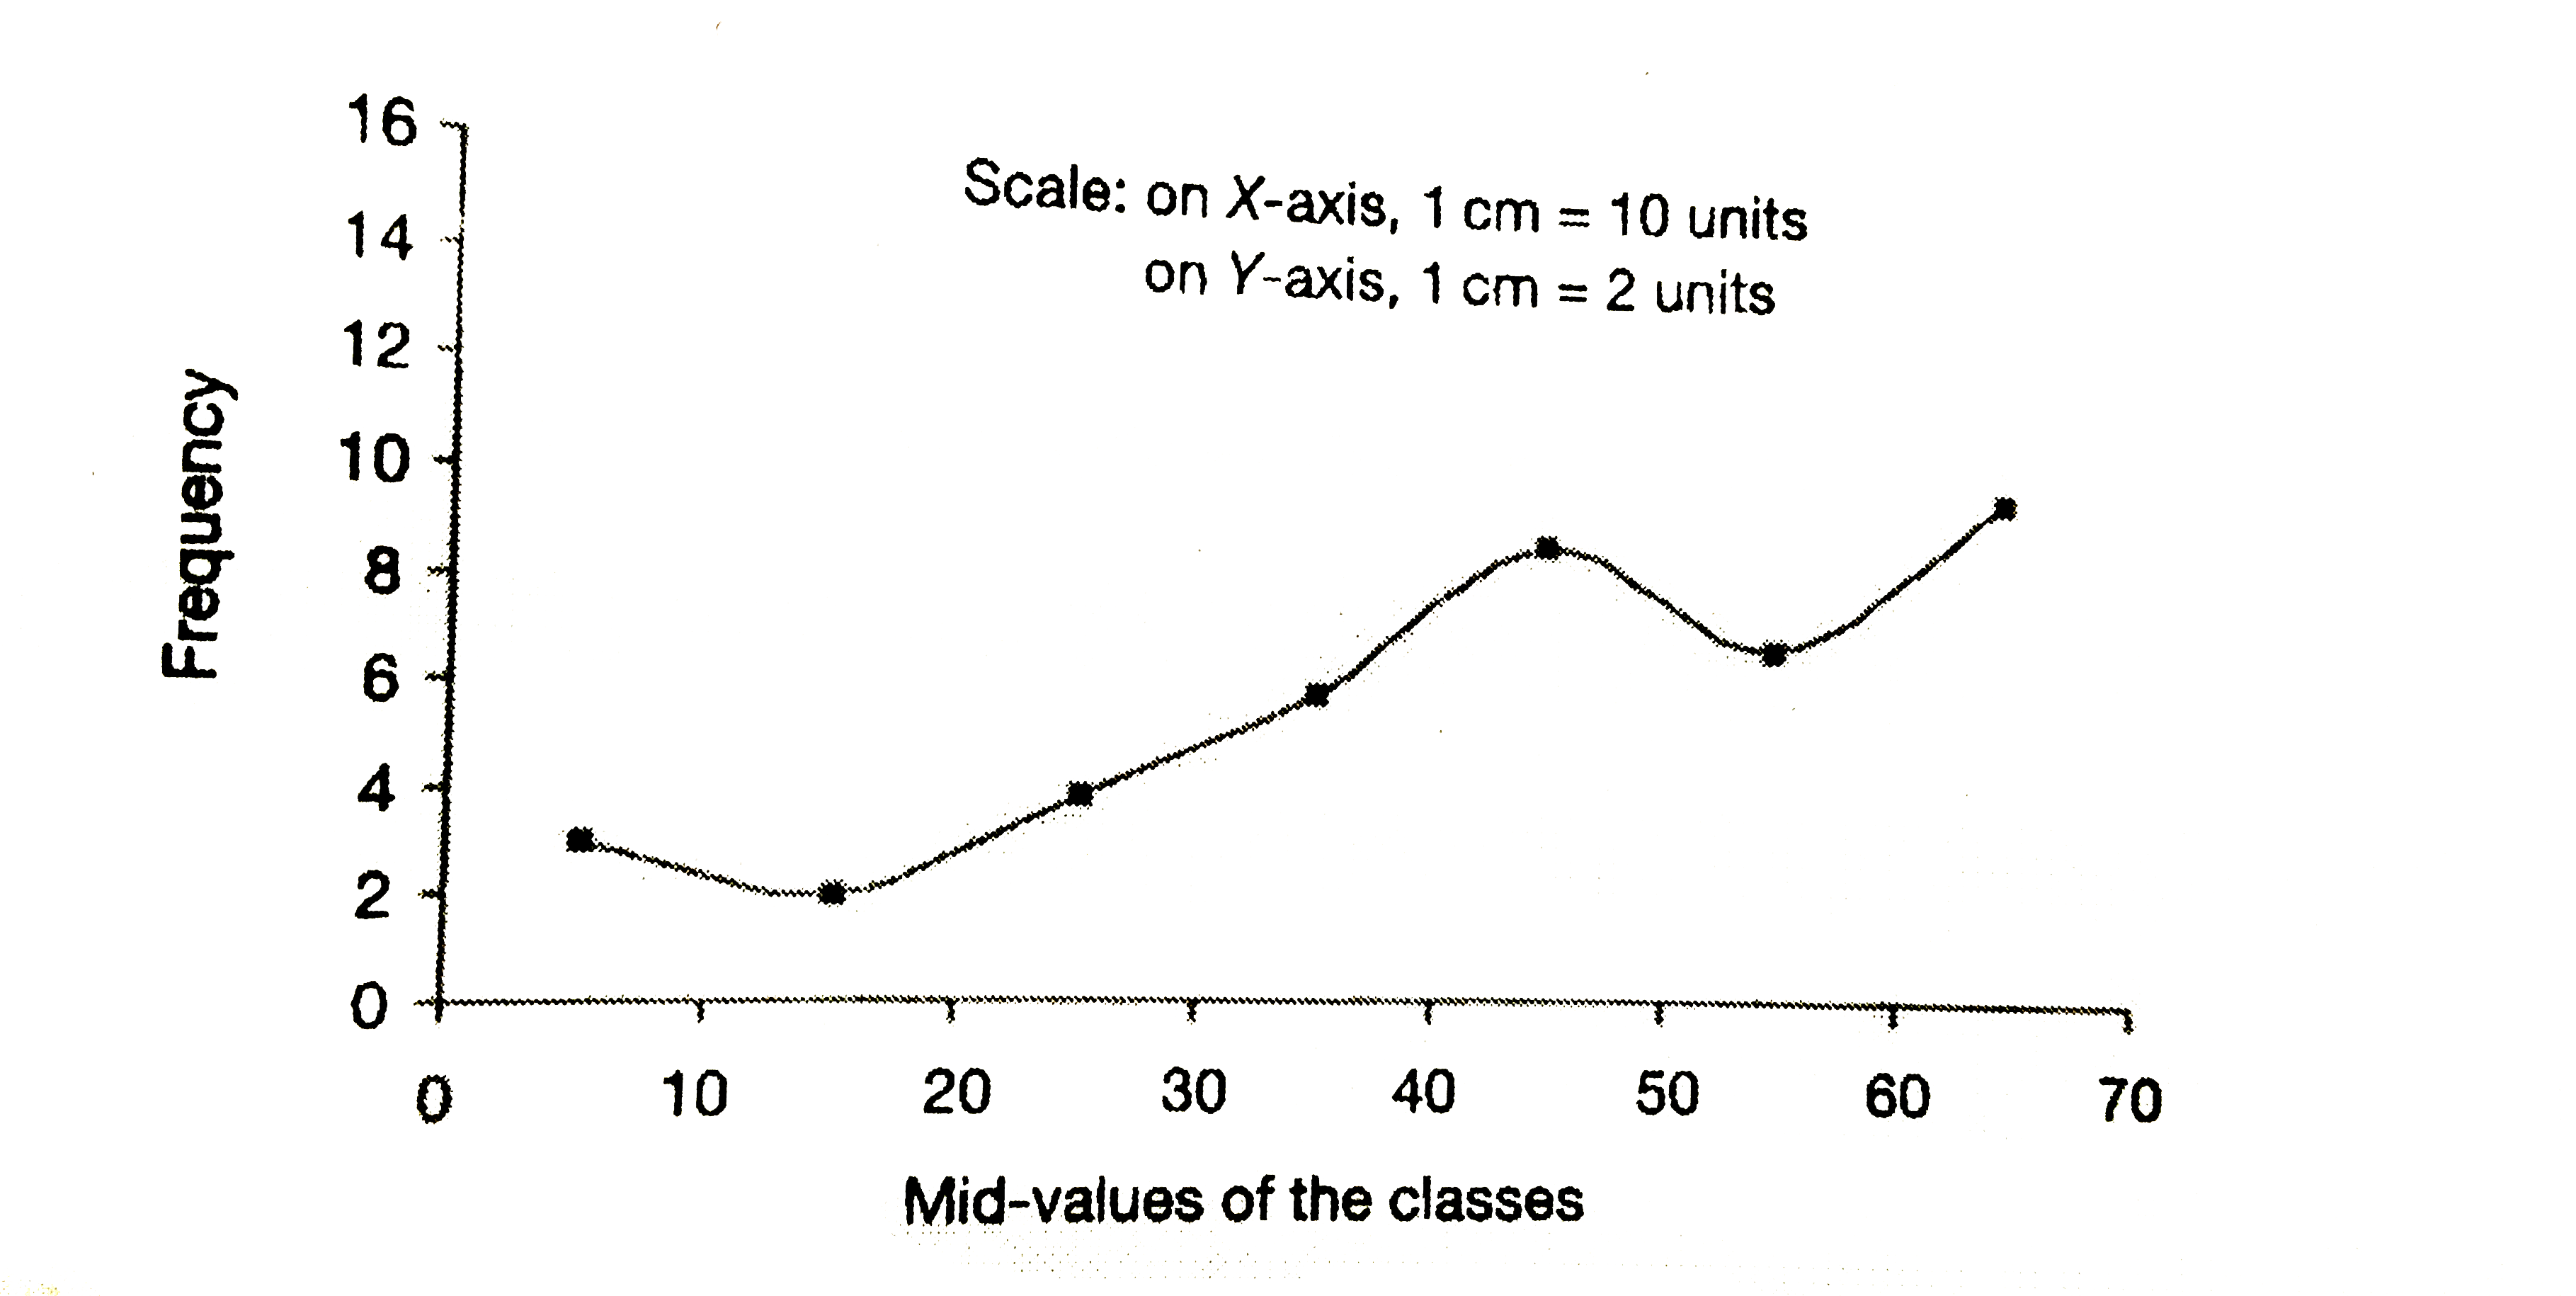
  1. Draw a frequency curve for the data given below: {:("Class Interval"...

    Text Solution

    |

  2. A Class of 40 students is divided into four groups named as A, B, C an...

    Text Solution

    |

  3. Life (in hour) of 10 bulbs from each of four different companies A, B,...

    Text Solution

    |

  4. If the mode of the observations 5, 4, 4, 3, 5, x, 3, 4, 3, 5, 4, 3 an...

    Text Solution

    |

  5. In a colony, the average age of the boys is 14 years and the average a...

    Text Solution

    |

  6. Find the median of the following data. {:("Class Interval",f),(" "0...

    Text Solution

    |

  7. In a class of 20 students, 10 boys brought 11 books each and 6 girls b...

    Text Solution

    |

  8. The mean of a set of 20 observations is 8 an another set of 30 observa...

    Text Solution

    |

  9. Find the approximate value of mean deviation about the mode of the fol...

    Text Solution

    |

  10. The mean of the following distribution is 4. Find the value of q. {:...

    Text Solution

    |

  11. If the ratio of mean and median of a certain data is 5 : 7, then find ...

    Text Solution

    |

  12. Find the mode of the following discrete series. {:(x,1,2,3,4,5,6,7,8...

    Text Solution

    |

  13. Find the median of the following data. {:(x,12,15,18,21,24),(f,4,7,2...

    Text Solution

    |

  14. Find the mean deviation about the median for the following data. {:(...

    Text Solution

    |

  15. Find the mode for the following data. {:("Class Interval",f),(" "0-...

    Text Solution

    |

  16. Find the quartile deviation of the following discrete series. {:(x,8...

    Text Solution

    |

  17. Find the arithmetic mean of the observations x + 5, x + 6, x + 10, x +...

    Text Solution

    |

  18. Find the mode of the following discrete series. {:(x,1,2,3,4,5,6,7,8...

    Text Solution

    |

  19. Find the mean of the following continuous distribution. {("Class Int...

    Text Solution

    |

  20. Which of the following is not changed for the observations 31, 48, 50,...

    Text Solution

    |