


Similar Questions
Explore conceptually related problems
Recommended Questions
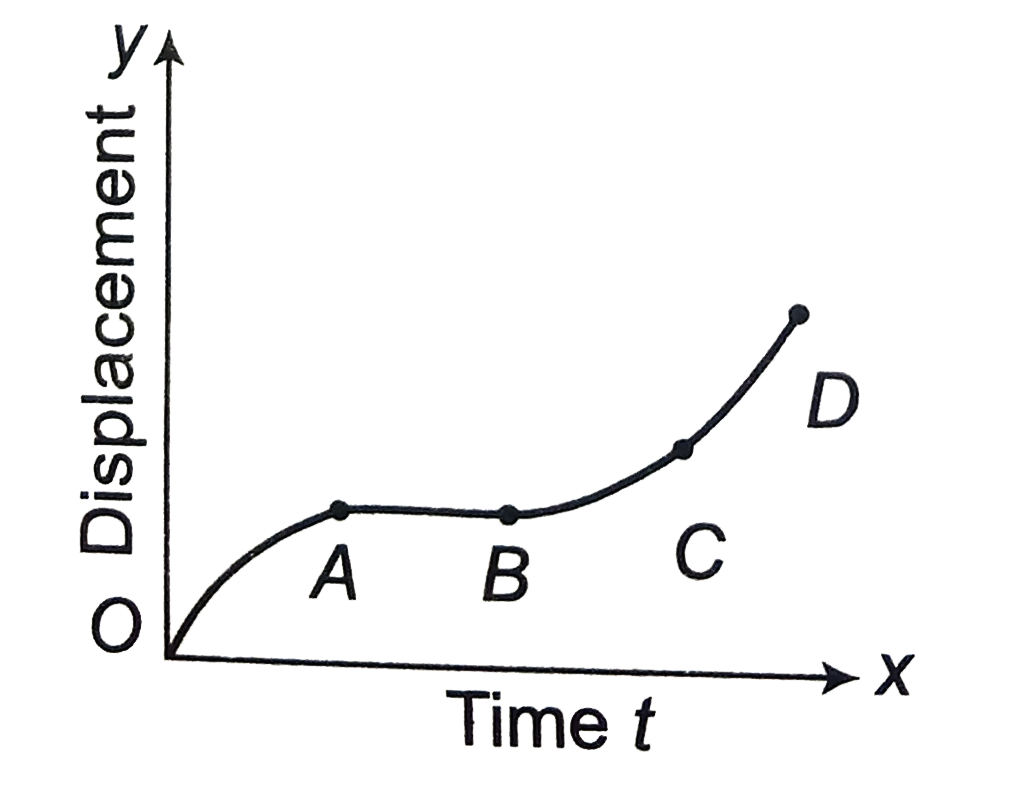
- The graph between the displacement x and time t for a particle moving ...
Text Solution
|
- Displacement-time graph of a particle moving in a straight line is as ...
Text Solution
|
- The graph between the displacement x and time t for a particle moving ...
Text Solution
|
- The velocity-time graph of a body is shown in figure. The ratio of mag...
Text Solution
|
- A particle moves in a plane from A to E along the shown path. It is gi...
Text Solution
|
- Displacement-time graph of a particle moving in a straight line is as ...
Text Solution
|
- एक सरल रेखा में गति करते हुए कण का विस्थापन-समय ग्राफ चित्र में दर्शाय...
Text Solution
|
- The graph between the displacement x and time t for a particle moving ...
Text Solution
|
- चित्र में सरल रेखीय गति करते हुए कण के विस्थापन x व समय t में आरेख खीं...
Text Solution
|