A
B
C
D
Text Solution
Verified by Experts
The correct Answer is:


Topper's Solved these Questions
Similar Questions
Explore conceptually related problems
PEARSON IIT JEE FOUNDATION-STATISTICS-TEST YOUR CONCEPTS (VERY SHORT ANSWER TYPE QUESTION )
- In a bar graph, if a bar of height 4 cm represents 28 units, the heigh...
Text Solution
|
- In a pie chart, the sum of the angles of all its com-ponents is .
Text Solution
|
- In a pie chart, the central angle of the component 120, when the total...
Text Solution
|
- In a bar graph, a bar of length 3.2 cm represents 96 units, then the n...
Text Solution
|
- In a pie chart, if the central angle of a component is 108^(@) and its...
Text Solution
|
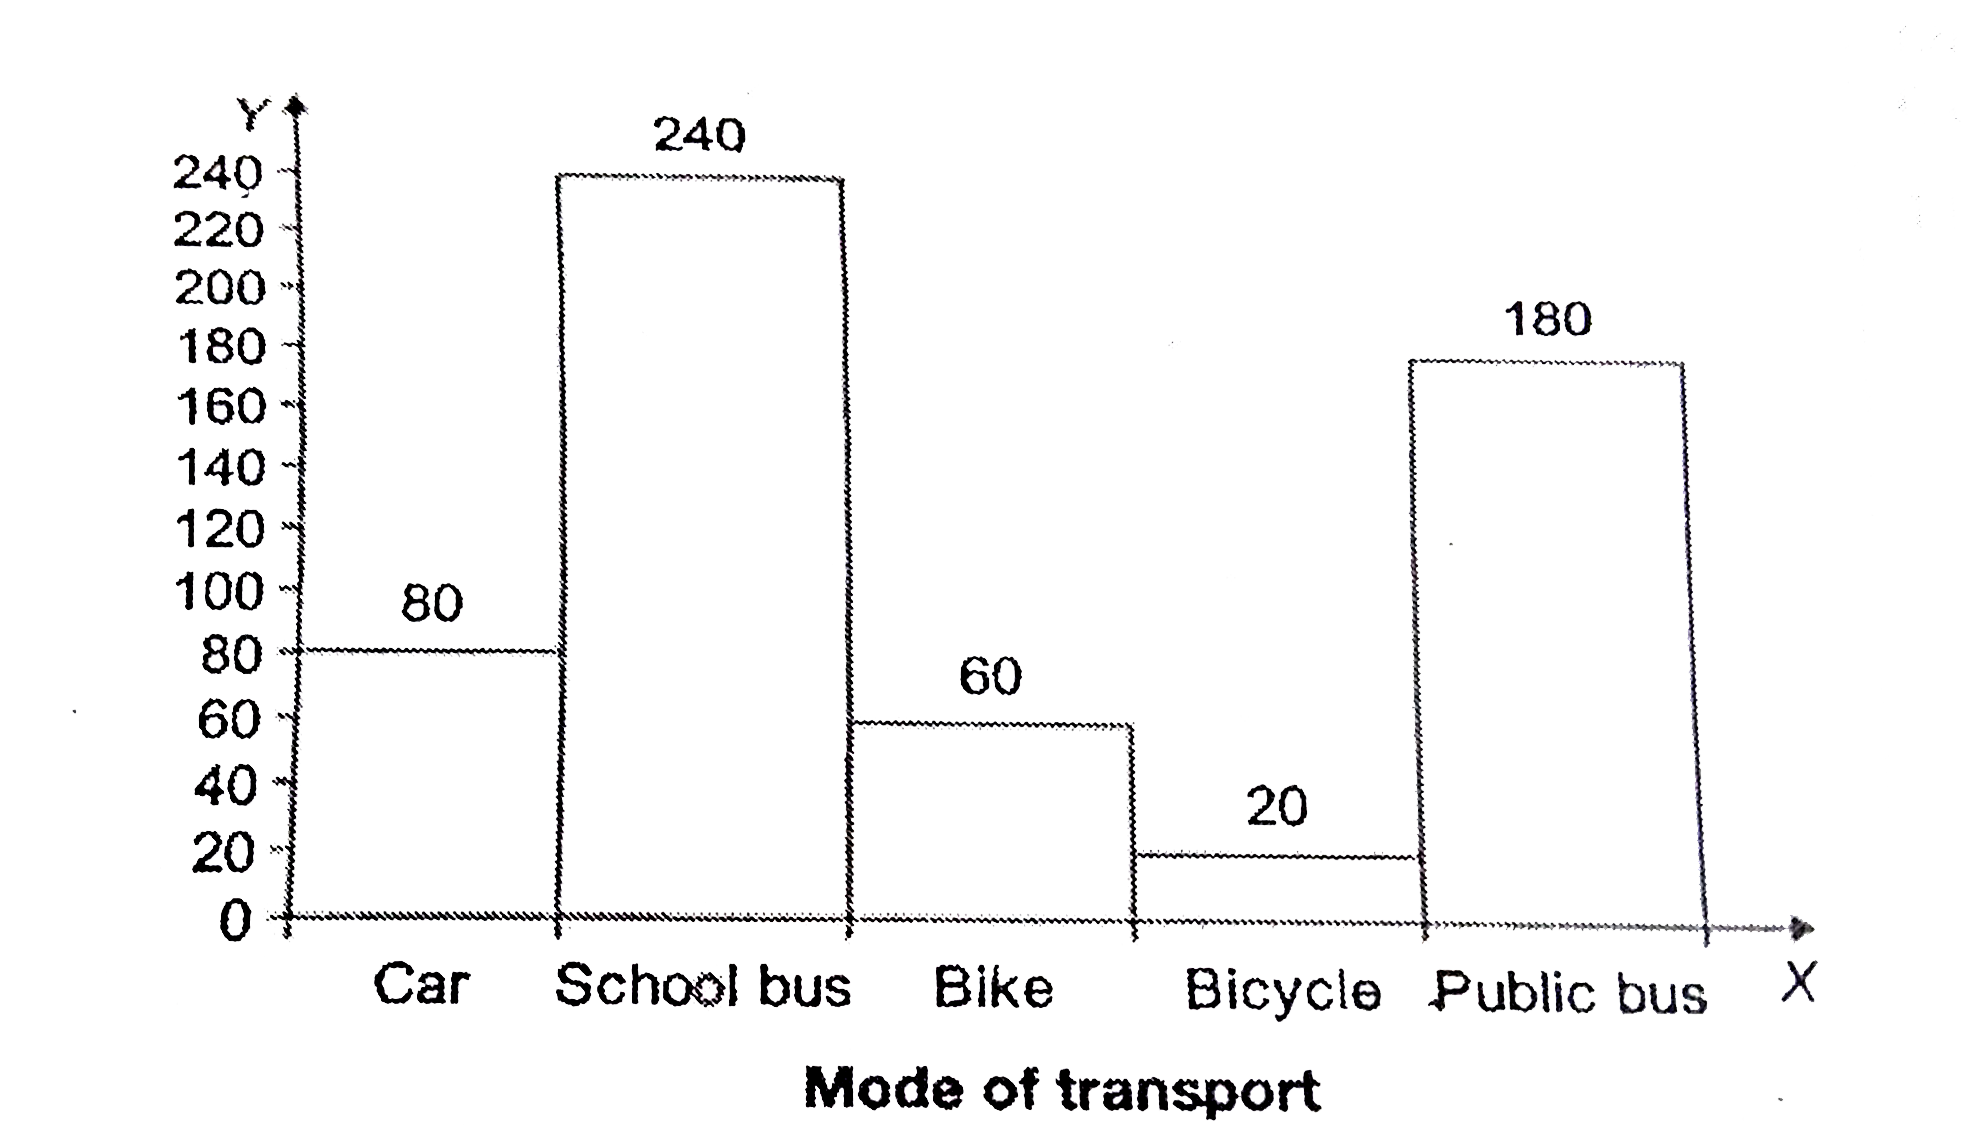
- The histogram shows the number of students using different modes of tr...
Text Solution
|
- The histogram shows the number of students using different modes of tr...
Text Solution
|
- The histogram shows the number of students using different modes of tr...
Text Solution
|
- The histogram shows the number of students using different modes of tr...
Text Solution
|
- The histogram shows the number of students using different modes of tr...
Text Solution
|
- For a given data, Rithik drew a bar graph and Krithik drew a pie chart...
Text Solution
|