Text Solution
Verified by Experts
The correct Answer is:


Topper's Solved these Questions
STATISTICS
PEARSON IIT JEE FOUNDATION|Exercise CONCEPT APPLICATION|5 VideosSTATISTICS
PEARSON IIT JEE FOUNDATION|Exercise ASSESSMENT TEST|10 VideosSTATISTICS
PEARSON IIT JEE FOUNDATION|Exercise TEST YOUR CONCEPTS (VERY SHORT ANSWER TYPE QUESTION )|11 VideosSETS
PEARSON IIT JEE FOUNDATION|Exercise Crossword|1 Videos
Similar Questions
Explore conceptually related problems
PEARSON IIT JEE FOUNDATION-STATISTICS-SHORT ANSWER TYPE QUESTION
- A bar graph is draph is drawn to the scale of 1cm=k units. The lengt...
Text Solution
|
- In a pie chart, a component is represented as a sector with sector ang...
Text Solution
|
- The given pie chart shows the amount of money spent by a school on var...
Text Solution
|
- The histogram given below shows the monthly salaries of four men. Stud...
Text Solution
|
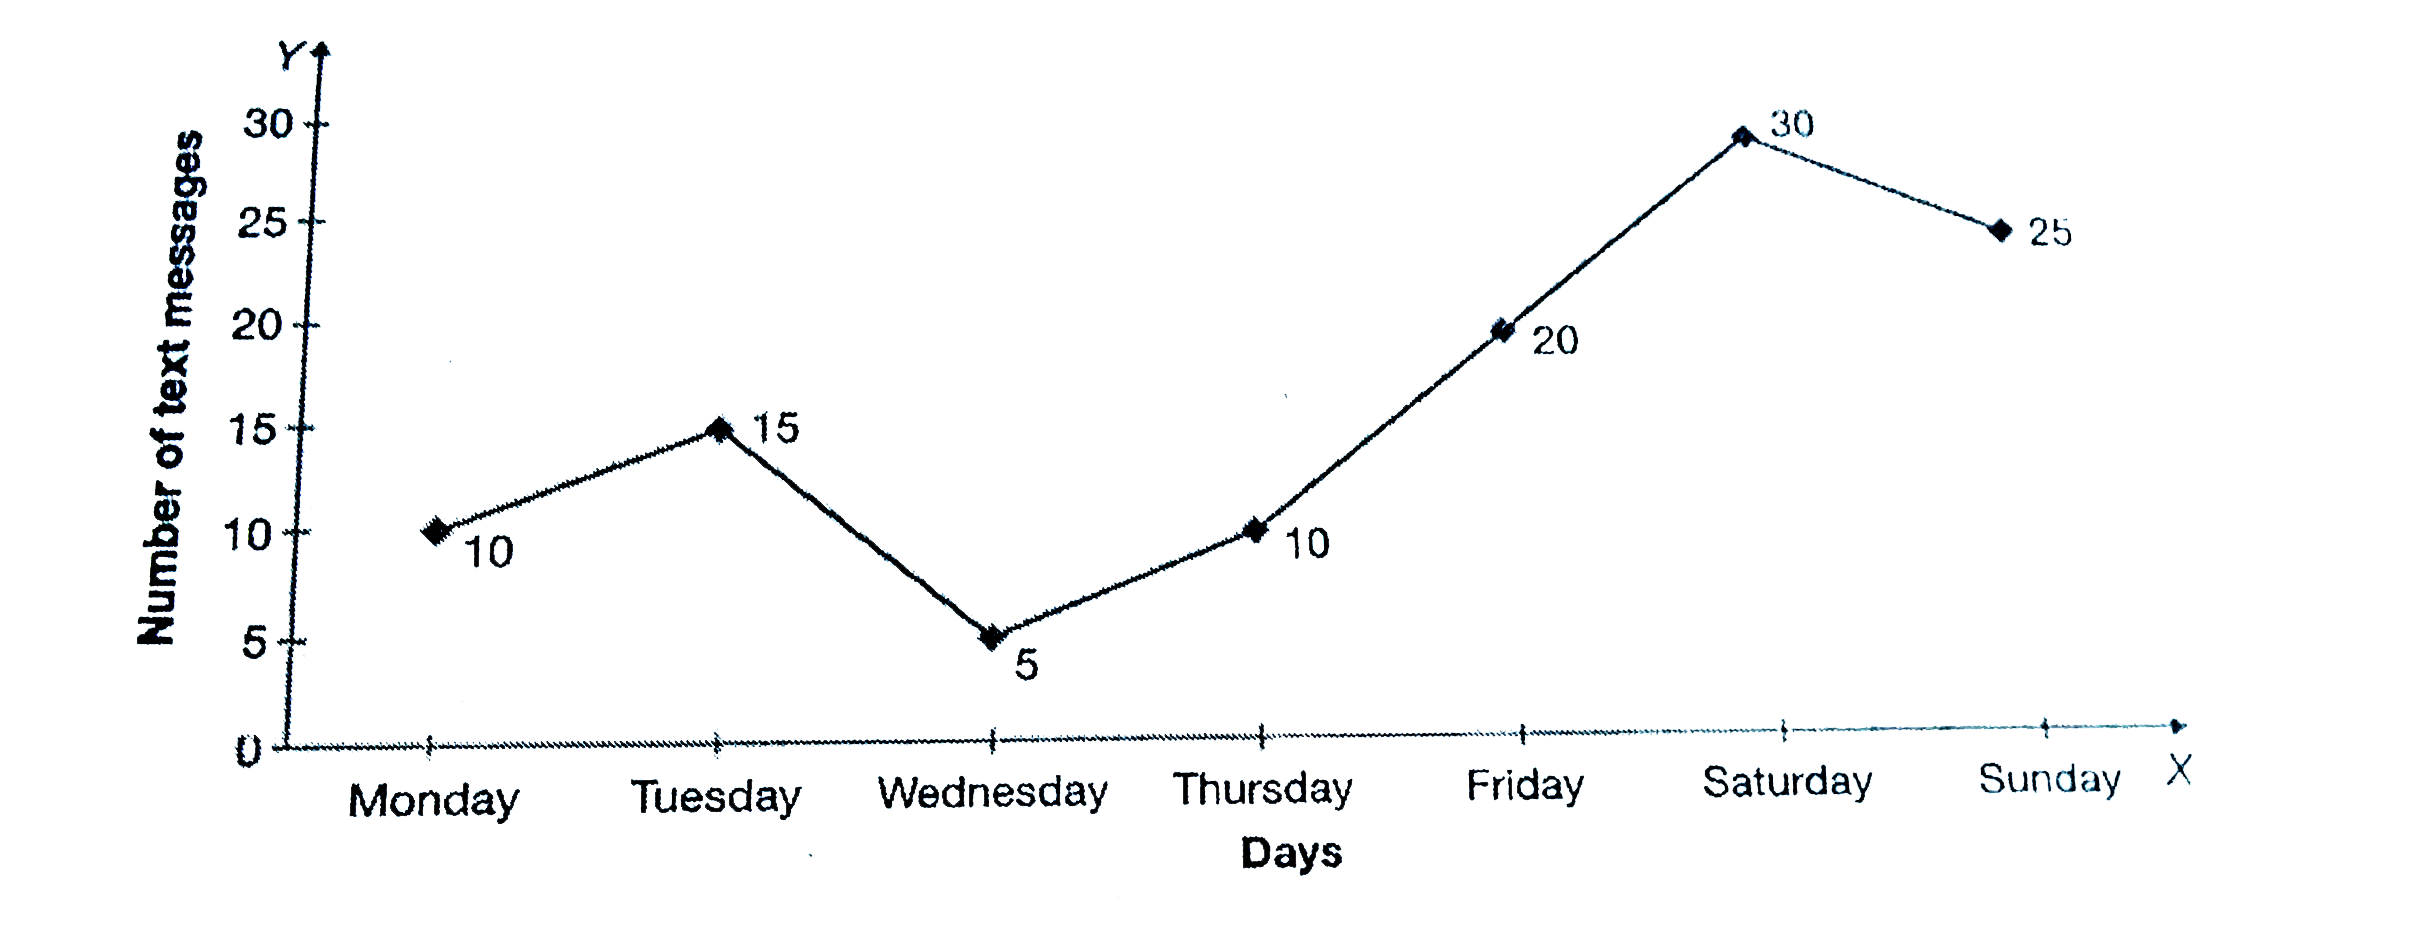
- The line graph given below shows the number of text messages received ...
Text Solution
|
- The following table shows the marks secored by a student in annual exa...
Text Solution
|
- The following table shows the household expenditure of family on diffe...
Text Solution
|
- The following table shows the number of toys sold by a mart during a w...
Text Solution
|
- The line graph shows the attendance of 35 students over a week. (...
Text Solution
|