


PEARSON IIT JEE FOUNDATION-STATISTICS-ASSESSMENT TEST
- In a bar graph, the length of a bar is 5.5 cm and it represents 450 un...
Text Solution
|
- In a pie chart, if the central angle of a component is 72^(@) ant its ...
Text Solution
|
- The following table shows the number of students in different classes ...
Text Solution
|
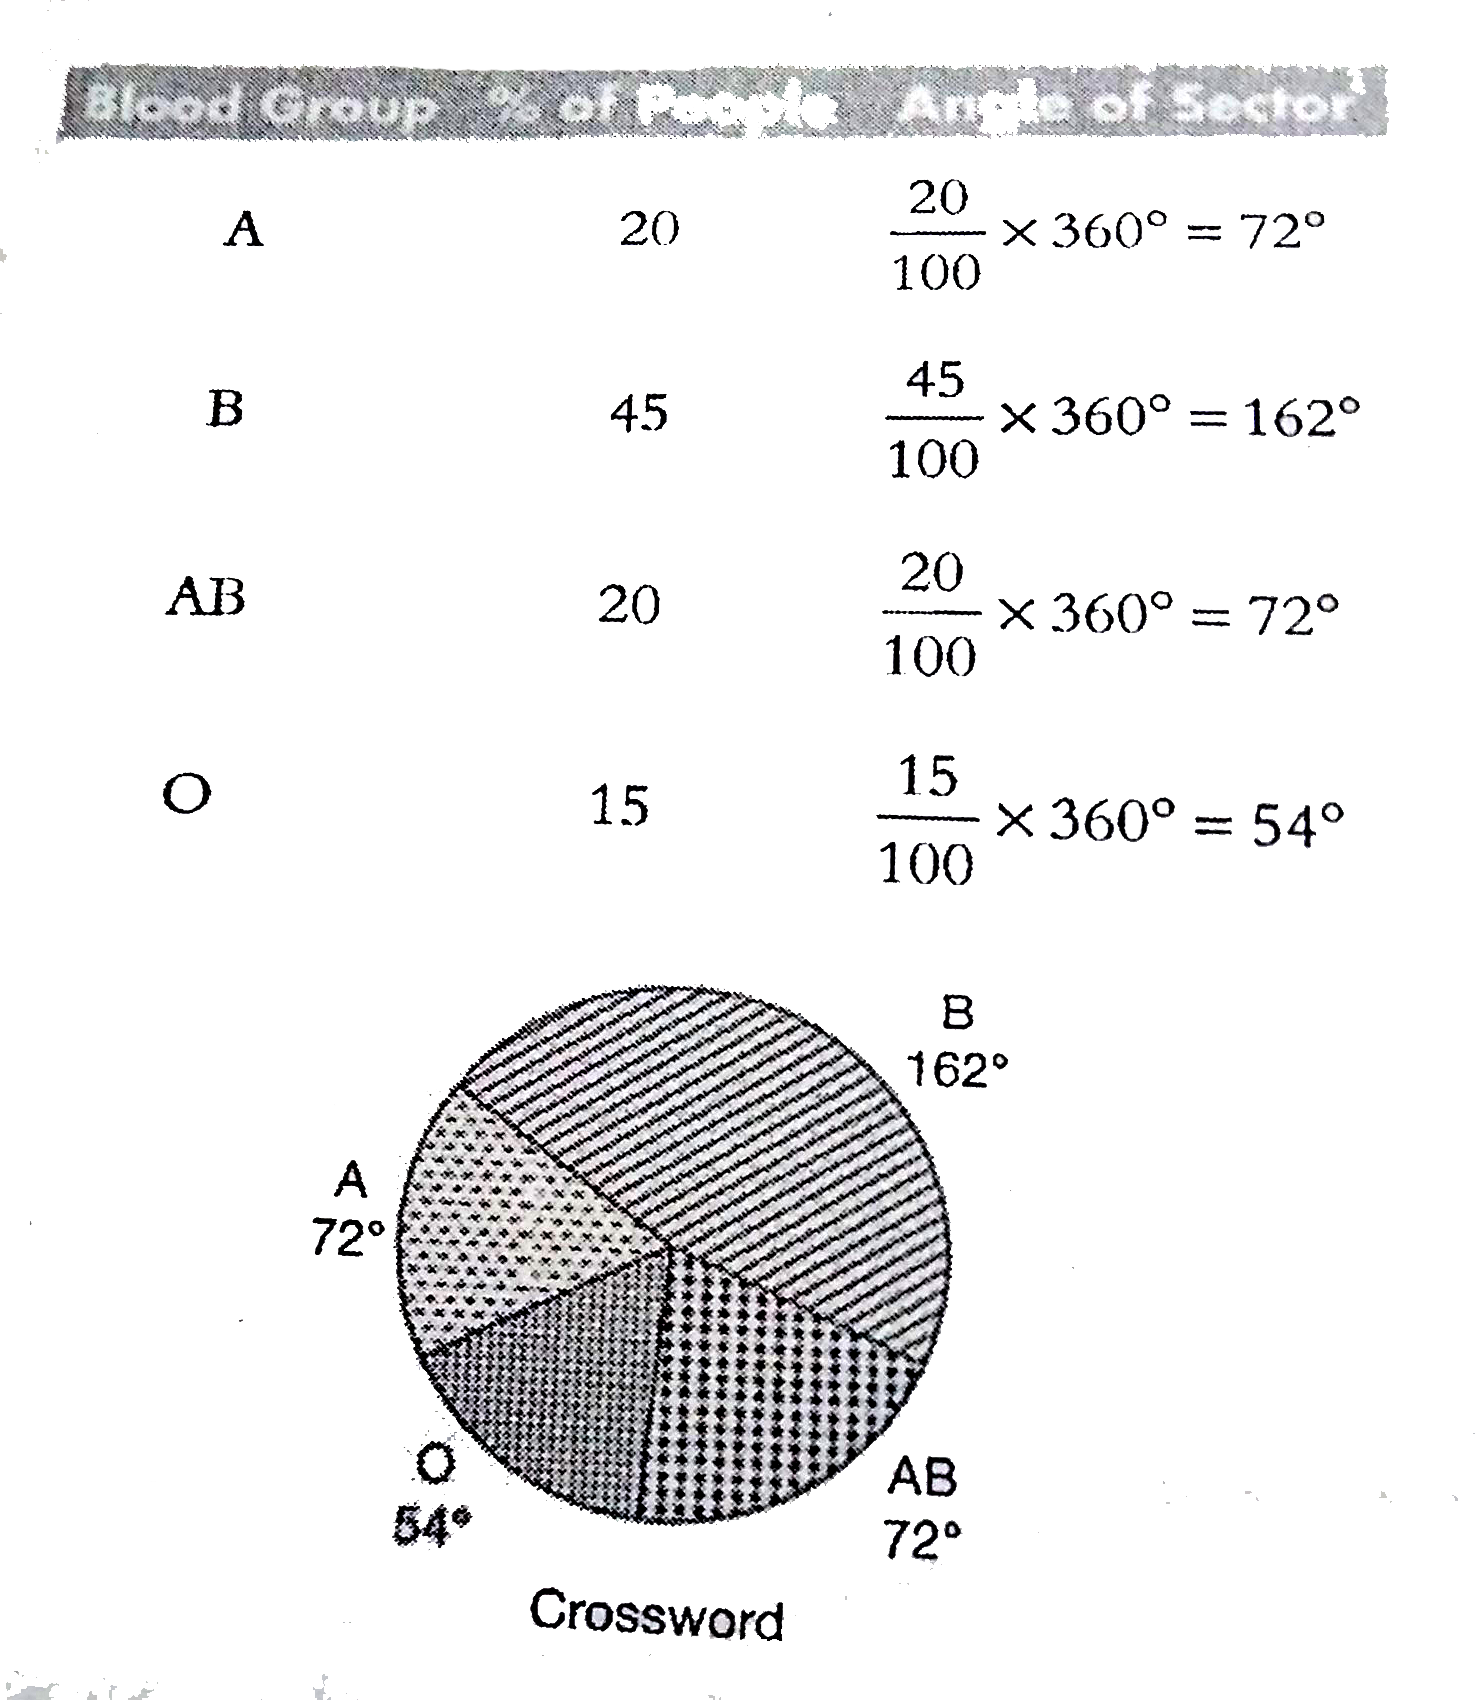
- The following table shows the percentage of people having different bl...
Text Solution
|
- The marks obtained by 7 students in Science test are given below : 2...
Text Solution
|
- 10 oranges are collected from a tree with following weights (in g). ...
Text Solution
|
- Find median of the temperature in (.^(@)C) recorded in Manali over a w...
Text Solution
|
- The means of 5 observations is 16. Find the sum of these observations.
Text Solution
|
- In class test, Priya obtained folowing scores in five subjects : 80,...
Text Solution
|
- Calculate data of 6 observations with mean as 10. {:("Across",,"D...
Text Solution
|