Text Solution
Verified by Experts


Topper's Solved these Questions
Similar Questions
Explore conceptually related problems
PEARSON IIT JEE FOUNDATION-STATISTICS-CONCEPT APPLICATION (LEVEL 3)
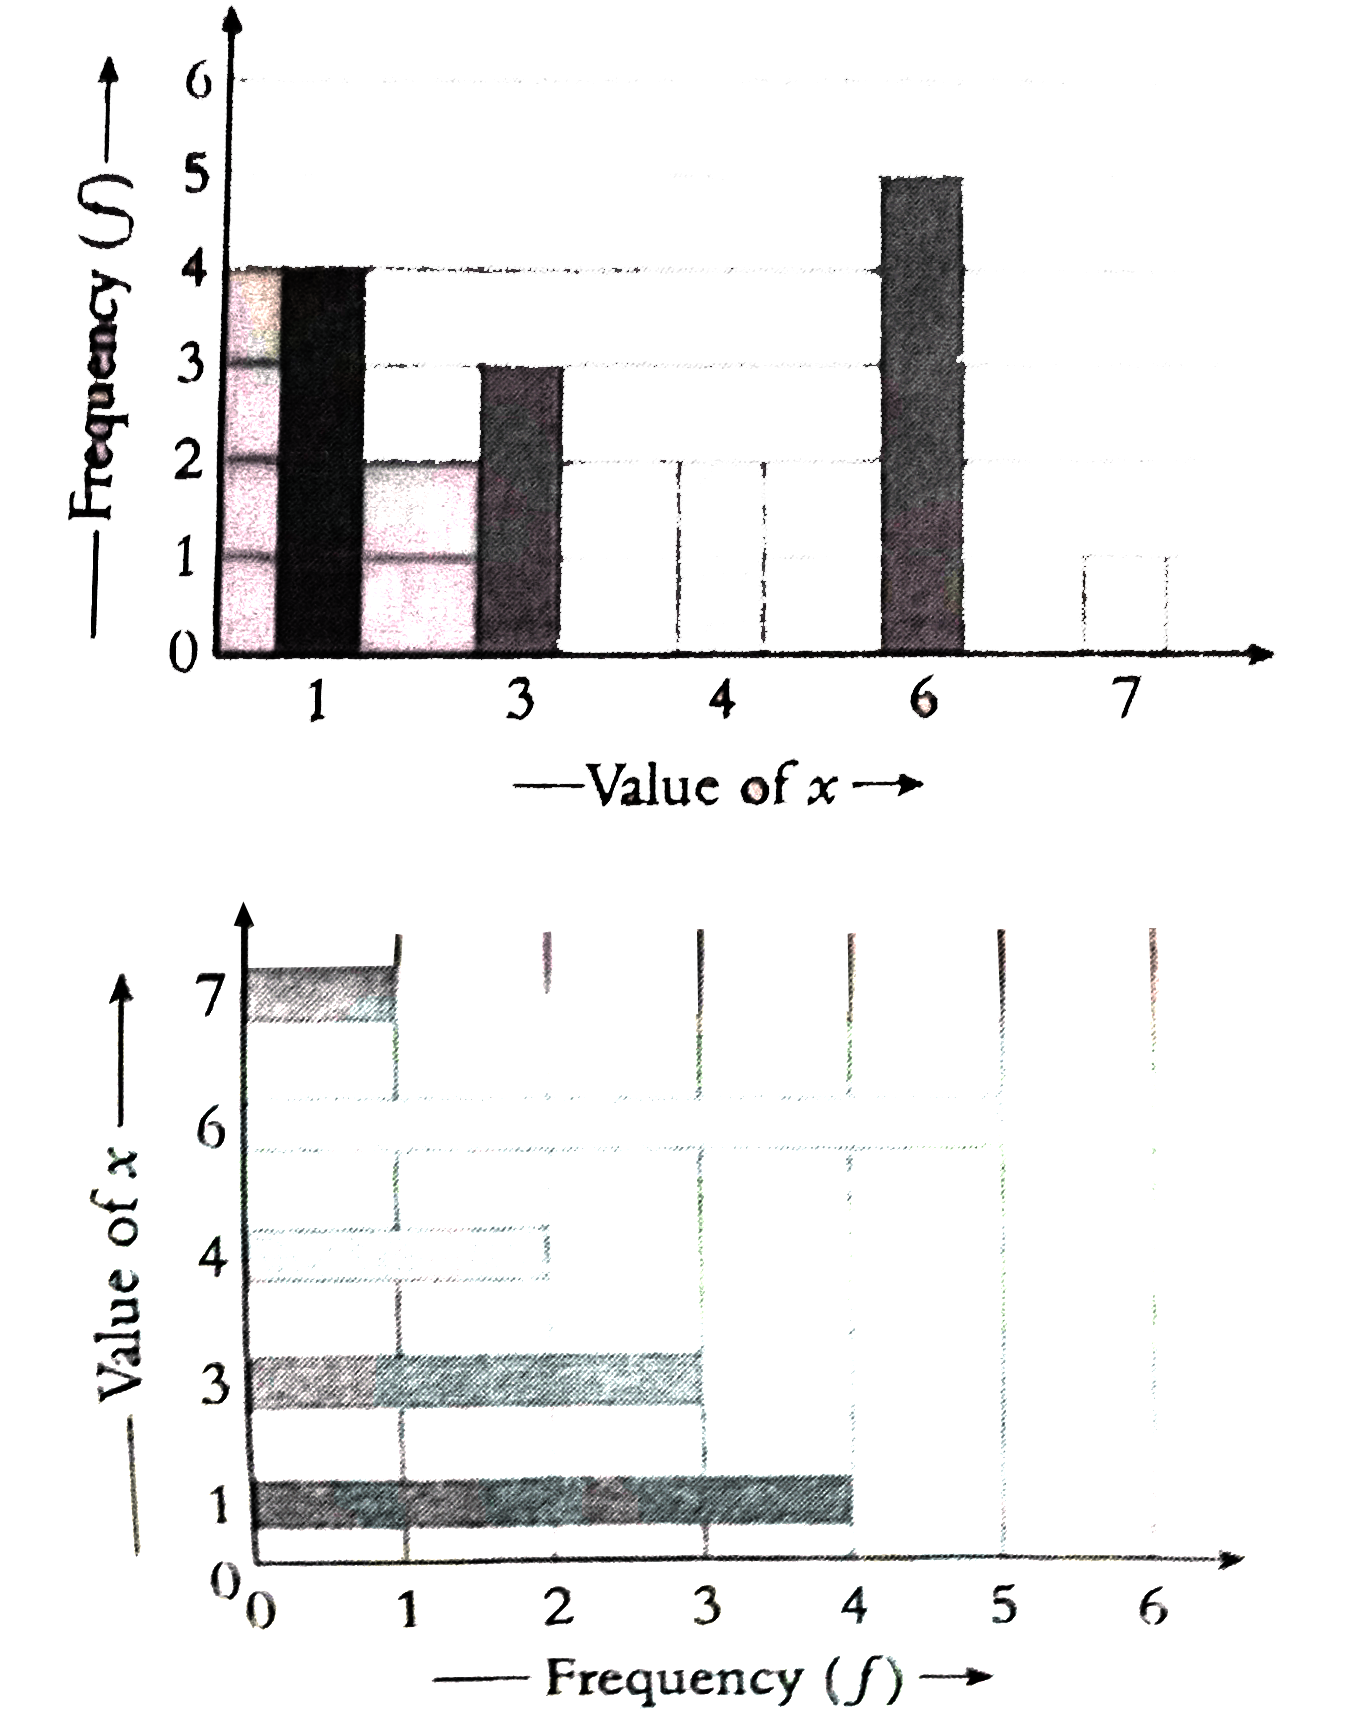
- Represent the following frequency distribution as a bar graph : {:(b...
Text Solution
|
- In factory, the daily wages (in Rs.) of 12 works are 75, 90 100, 120, ...
Text Solution
|
- If the mean of 9, 10, 15, x, 6, 8, and 12 is 11, then the median of th...
Text Solution
|
- The mode of the data 9, x, 6, 3, 4, 9, 8, 6, 4, 6, is 6. which of the ...
Text Solution
|
- The median, mode , and mean of a data is 9, if there are five integers...
Text Solution
|
- The median of 10, 12, x, 6, 18 is 10. Then which of the following is t...
Text Solution
|
- The mean of 10 observation is 15. If one observation 15 is added, then...
Text Solution
|
- The range of the data 15, 18, 17, 16, 14, x, 12, 10, 9, 15 is 9. Which...
Text Solution
|
- The range of a data is x, the median and the mode of the data is 7 eac...
Text Solution
|
- For a pie chart, a studen t calculates the central angle of a componen...
Text Solution
|
- In a bar graph, length of a bar is 6.4 cm and it represents 256 units....
Text Solution
|
- A bag contains 4 green balls, 4 red balls, and 2 blue bals. If a ball ...
Text Solution
|