A
B
C
D
Text Solution
Verified by Experts
The correct Answer is:


Topper's Solved these Questions
STATISTICS
PEARSON IIT JEE FOUNDATION|Exercise Short Answer Type|21 VideosSTATISTICS
PEARSON IIT JEE FOUNDATION|Exercise Essay Type|6 VideosSTATISTICS
PEARSON IIT JEE FOUNDATION|Exercise CONCEPT APPLICATION (LEVEL 3)|11 VideosSIMPLE INTEREST AND COMPOUND INTEREST
PEARSON IIT JEE FOUNDATION|Exercise Level 3|9 Videos
Similar Questions
Explore conceptually related problems
PEARSON IIT JEE FOUNDATION-STATISTICS-Very Short Answer Type
- If a dics is thrown, then the probability of getting an even number is...
Text Solution
|
- The mode of a data is .
Text Solution
|
- The central angle of a component in a pie chart is .
Text Solution
|
- The graphs drawn generally for representing a data are .
Text Solution
|
- When a dice is thrown, the outcomes are .
Text Solution
|
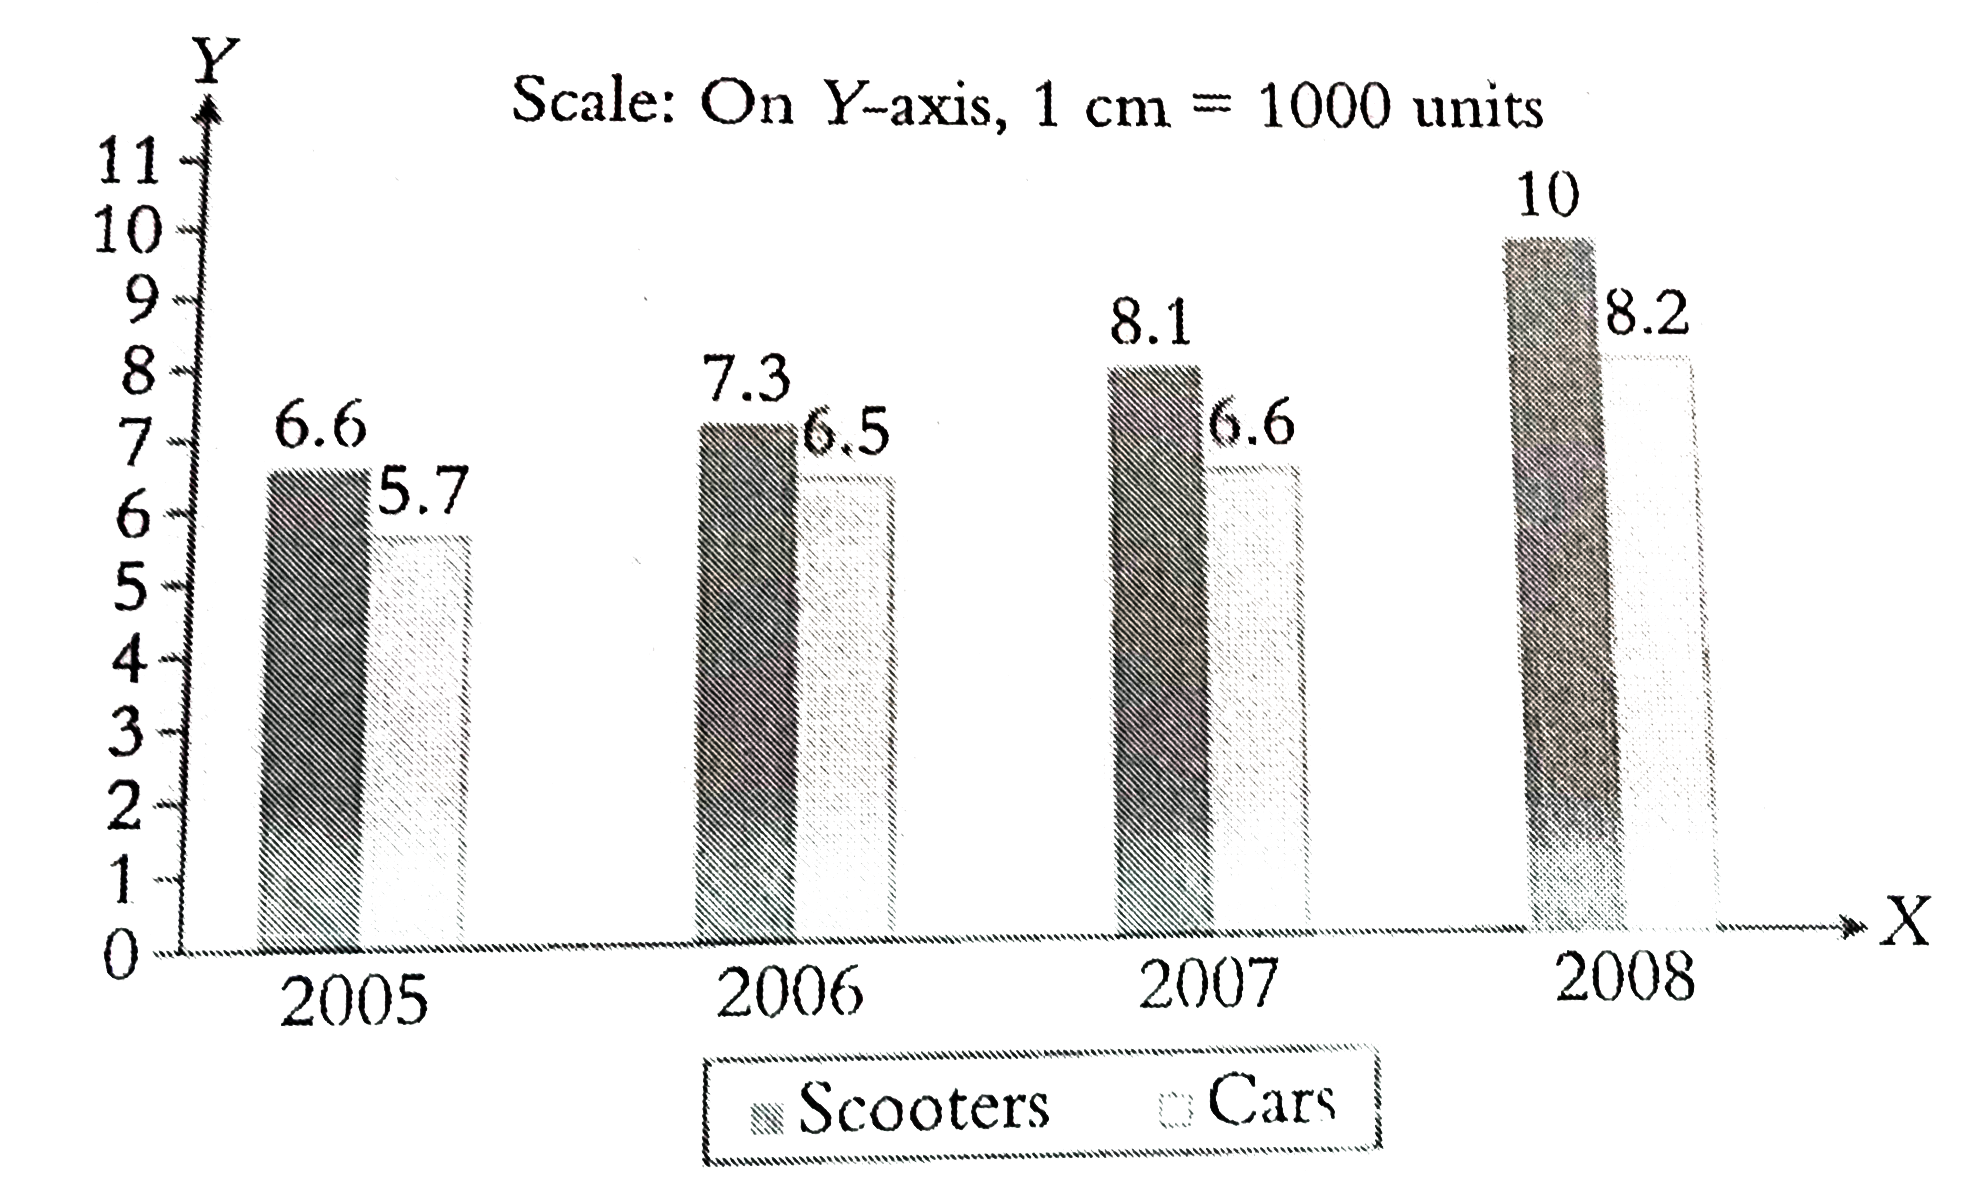
- In which year is the difference between the sales of the scooters and ...
Text Solution
|
- Total number of vehicles (scooters and cars) sold in the year 2005 and...
Text Solution
|
- Find the maximum difference between sales of scooters and that of cars...
Text Solution
|
- Find the total number of scooters sold in the four years.
Text Solution
|
- Find the ratio between the total number of vehicles sold (scooters and...
Text Solution
|
- There are 10 cards numbered from 1 to 10 in a box. If a card is drawn ...
Text Solution
|
- The mode of the data 48, 45, 49, 51, 46, 48, 47, 49, 48, and 51 is .
Text Solution
|
- When a dice is rooled, find the probability of getting an even prime n...
Text Solution
|
- The range of 12 observations is 60. If the least observation is 90, th...
Text Solution
|
- Find the median of the data 35, 28, 49, 56, 79, 81, 73 and 80.
Text Solution
|
- There are 20 marbles in a box which are marked with distinct numbers f...
Text Solution
|
- The mode of the data 35, 25, 26, 33, 31, x, and 30 is 26, then x is .
Text Solution
|
- The median of the data 18, 42, 31, 25, 26, 38 and 43 is .
Text Solution
|
- The sum of 20 observation is 500, then the mean is .
Text Solution
|
- There are 100 cards numbered from 1 to 100 in a box. If a card is draw...
Text Solution
|