A
B
C
D
Text Solution
Verified by Experts


Topper's Solved these Questions
Similar Questions
Explore conceptually related problems
FULL MARKS-SAMPLE PAPER 2 (SOLVED)-PART IV
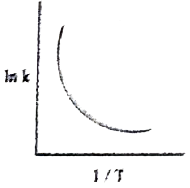
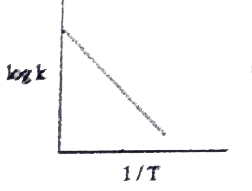
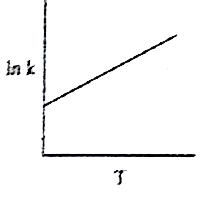
- Among the following graphs showing variation of rate constant w...
Text Solution
|
- (a) (i) Describle a method for refining nickel. (ii) Why gr...
Text Solution
|
- (A)(i) Arrange the following in order of increasing molar conduct...
Text Solution
|
- (a) (i) Calculate pH of 10^(-7) M HCI, (ii) Define corrosion .Giv...
Text Solution
|
- (a) An organic compound (A) of molecular formula C(6)H(6)O gives w...
Text Solution
|
- How will you distinguish between primary secondary and tertiary ...
Text Solution
|