Text Solution
Verified by Experts


Topper's Solved these Questions
Similar Questions
Explore conceptually related problems
FULL MARKS-SAMPLE PAPER 2 (SOLVED)-PART III
- A hydride of 2^(nd) period alkali metal (A ) on reaction with c...
Text Solution
|
- Discuss the uses of Phosphine.
Text Solution
|
- Calculate the percentage efficiency of packing in case of body cen...
Text Solution
|
- H(3)BO(3) accepts hydroxide ion from water shown below, H(3) ...
Text Solution
|
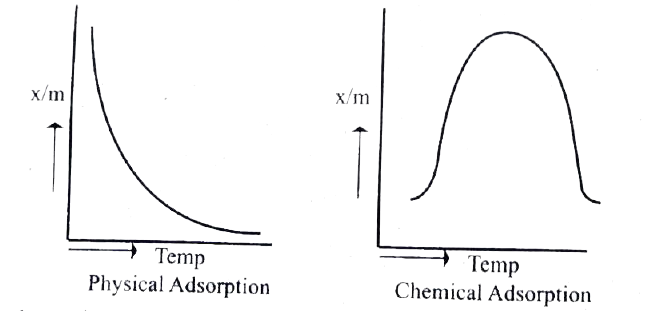
- Explain graphical representation of chemical adsorption and physica...
Text Solution
|
- Mention the uses of Glycerol .
Text Solution
|
- Give the differences between primary and secondary structure of protei...
Text Solution
|
- Draw the structure of (i) procaine (ii) Lidocaine .
Text Solution
|
- Explain the variation in EM^(3+) //m^(2+)^(0) 3D Series.
Text Solution
|