Text Solution
Verified by Experts
The correct Answer is:


Similar Questions
Explore conceptually related problems
Recommended Questions
- Observe the following graphs carefully and select the true of false st...
Text Solution
|
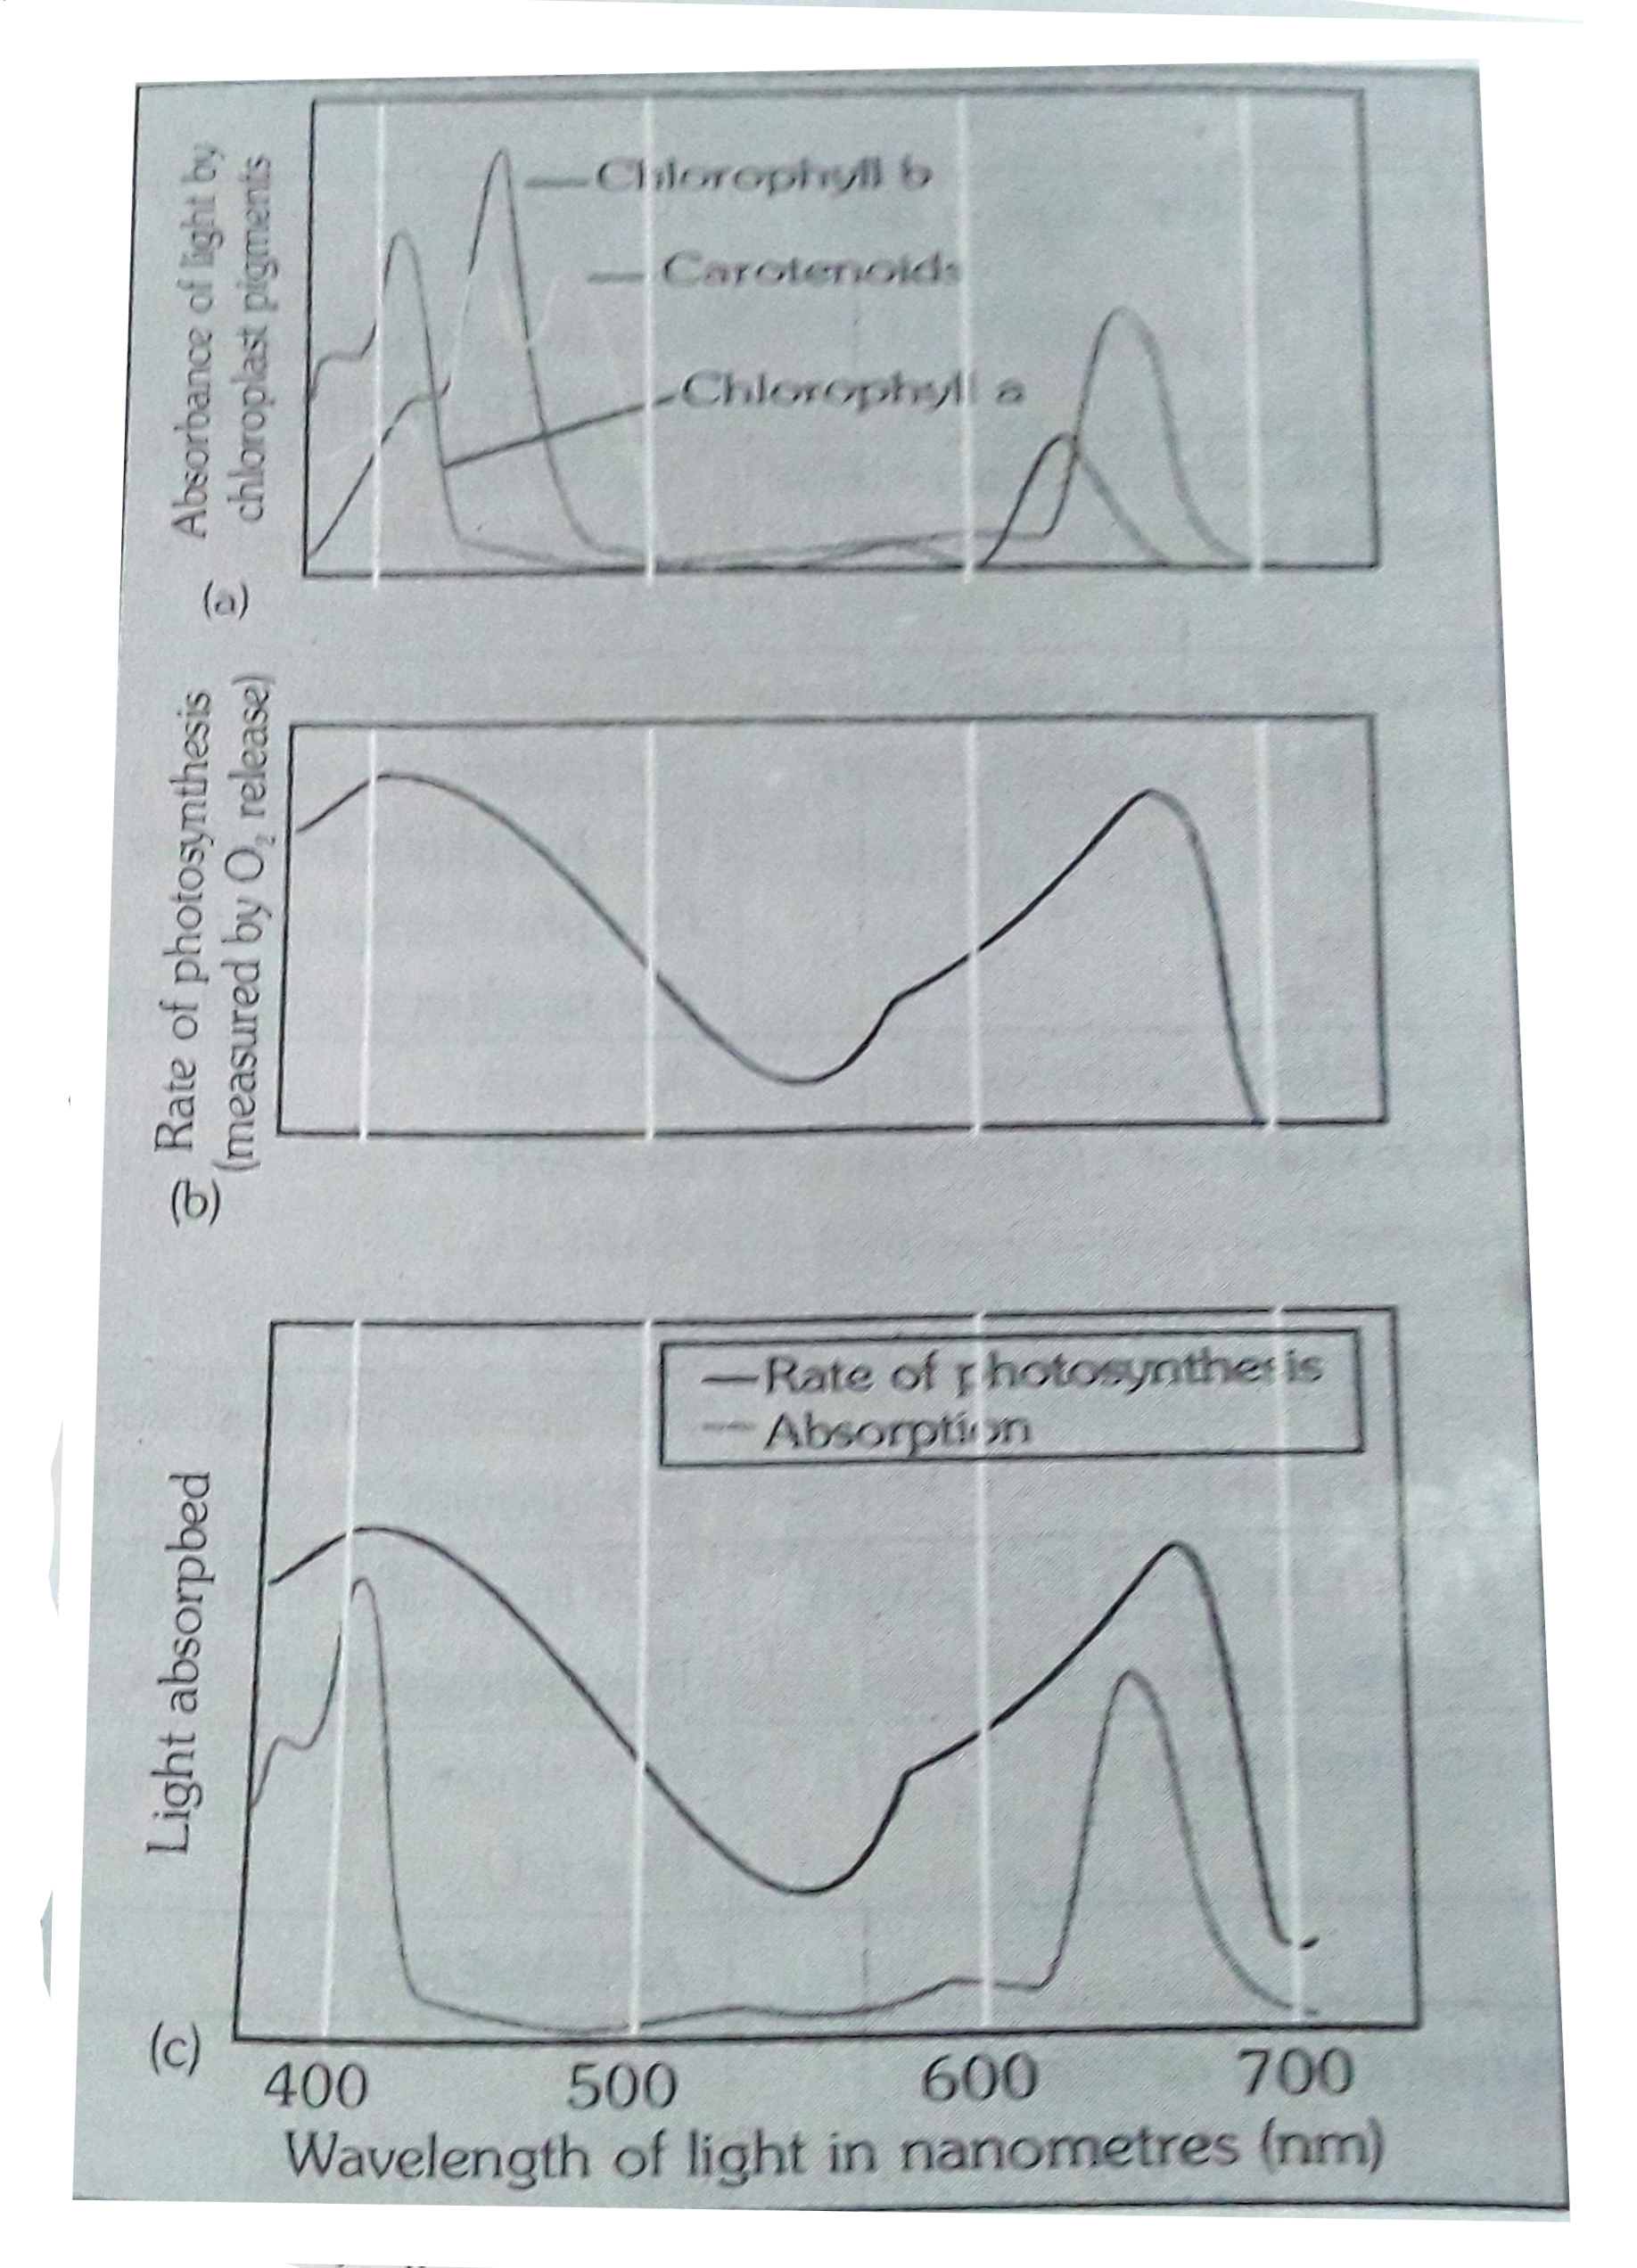
- Three of the graphs below show the absortion spectra of photosynthetic...
Text Solution
|
- The percentage of blue and red wavelengths of light absorbed by chloro...
Text Solution
|
- In the figure given below, the black line ( upper ) indicates action s...
Text Solution
|
- Maximum absorption of light by chlorophyll a occurs in which regions o...
Text Solution
|
- Assertion: Chlorophyll a is the chief pigment associated with photosyn...
Text Solution
|
- The variation of pH during the titration of 0.5 N Na2CO3 with 0.5 N HC...
Text Solution
|
- दिया गया ग्राफ तीन प्रकाश संश्लेषीय वर्णकों, क्लोरोफिल a, क्लोरोफिल b ...
Text Solution
|
- क्लोरोफिल का अवशोषण वर्णक्रम प्रकाश के एवं क्षेत्रों में अधिकतम अवशोषण...
Text Solution
|