


Similar Questions
Explore conceptually related problems
Recommended Questions
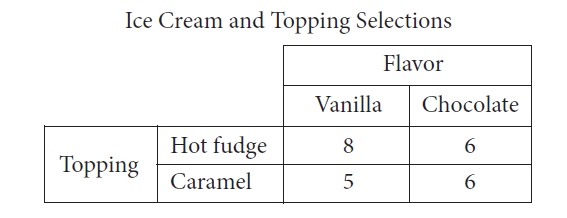
- The table above shows the flavors of ice cream and the toppings chosen...
Text Solution
|
- Determine the point of symmetry of a regular hexagon. <img src="htt...
Text Solution
|
- Match the following Column A to Column B
Text Solution
|
- The inequation represented by the graph given below is : <img src="htt...
Text Solution
|
- The inequation that best describes the graph given below is <img src=...
Text Solution
|
- The inequation that best describes the following graph is <img src="h...
Text Solution
|
- A cylindrical ice-cream pot of radius 6 cm and height 21 cm full of ic...
Text Solution
|
- The table above shows the flavors of ice cream and the toppings chosen...
Text Solution
|
- Jim and Pam bought x quarts of ice cream for a party. If 10 people att...
Text Solution
|