


Similar Questions
Explore conceptually related problems
Recommended Questions
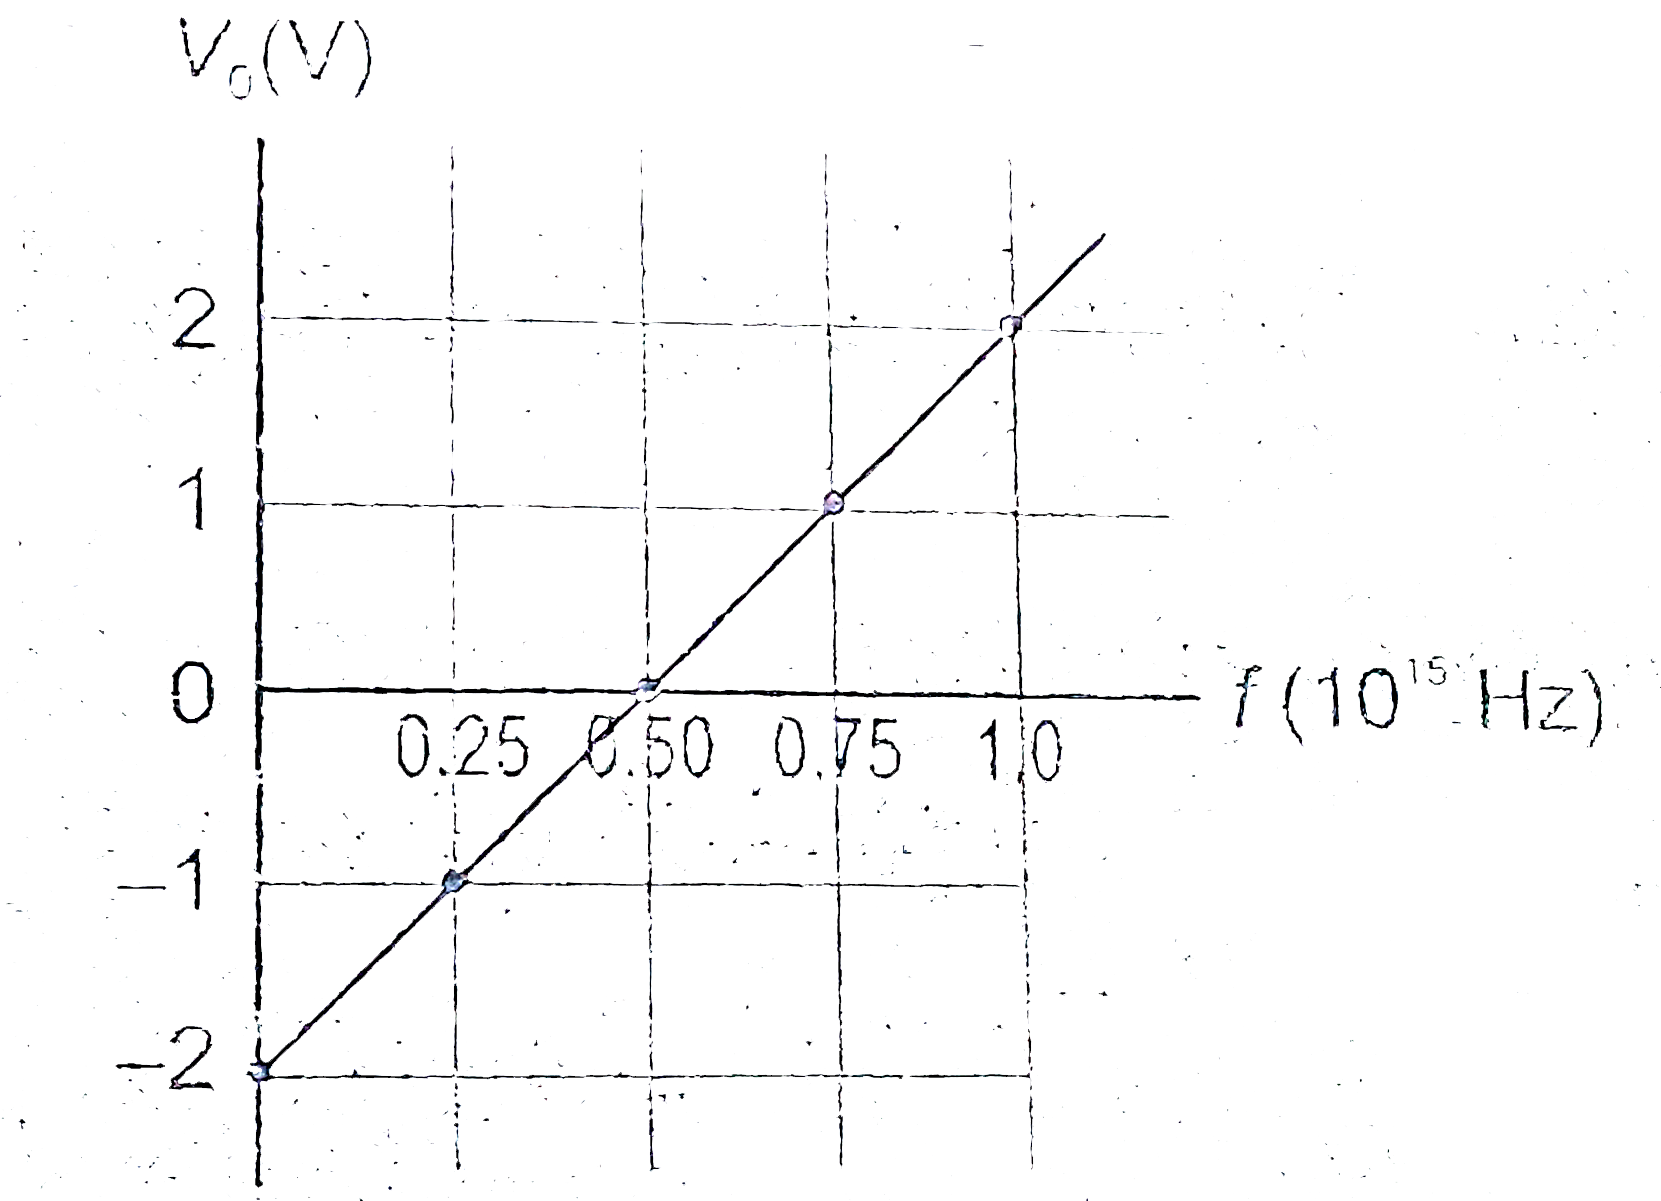
- The following figure shows a graph for the stopping potential as a fun...
Text Solution
|
- When a metallic surface is illuminated with monochromatic light of wav...
Text Solution
|
- When a metallic surface is illuminated with monochromatic light of wav...
Text Solution
|
- The stopping potential as a function of the frequency of the incident ...
Text Solution
|
- When a metallic surface is illuminated with monochromatic light of wav...
Text Solution
|
- When a metallic surface is illuminated with monochromatic light of wav...
Text Solution
|
- The following figure shows a graph for the stopping potential as a fun...
Text Solution
|
- The stopping potential as a function of frequency of incident radiatio...
Text Solution
|
- What is the stopping potential, when a metal surface with work functio...
Text Solution
|