 .
.


Similar Questions
Explore conceptually related problems
Recommended Questions
- 45 Shows position time graph of a particle of mass 100g Find the impul...
Text Solution
|
- The position time graph of a body of mass 2 kg is as given in What is ...
Text Solution
|
- Shows position time graph of a particle of mass 100g Find the impulse ...
Text Solution
|
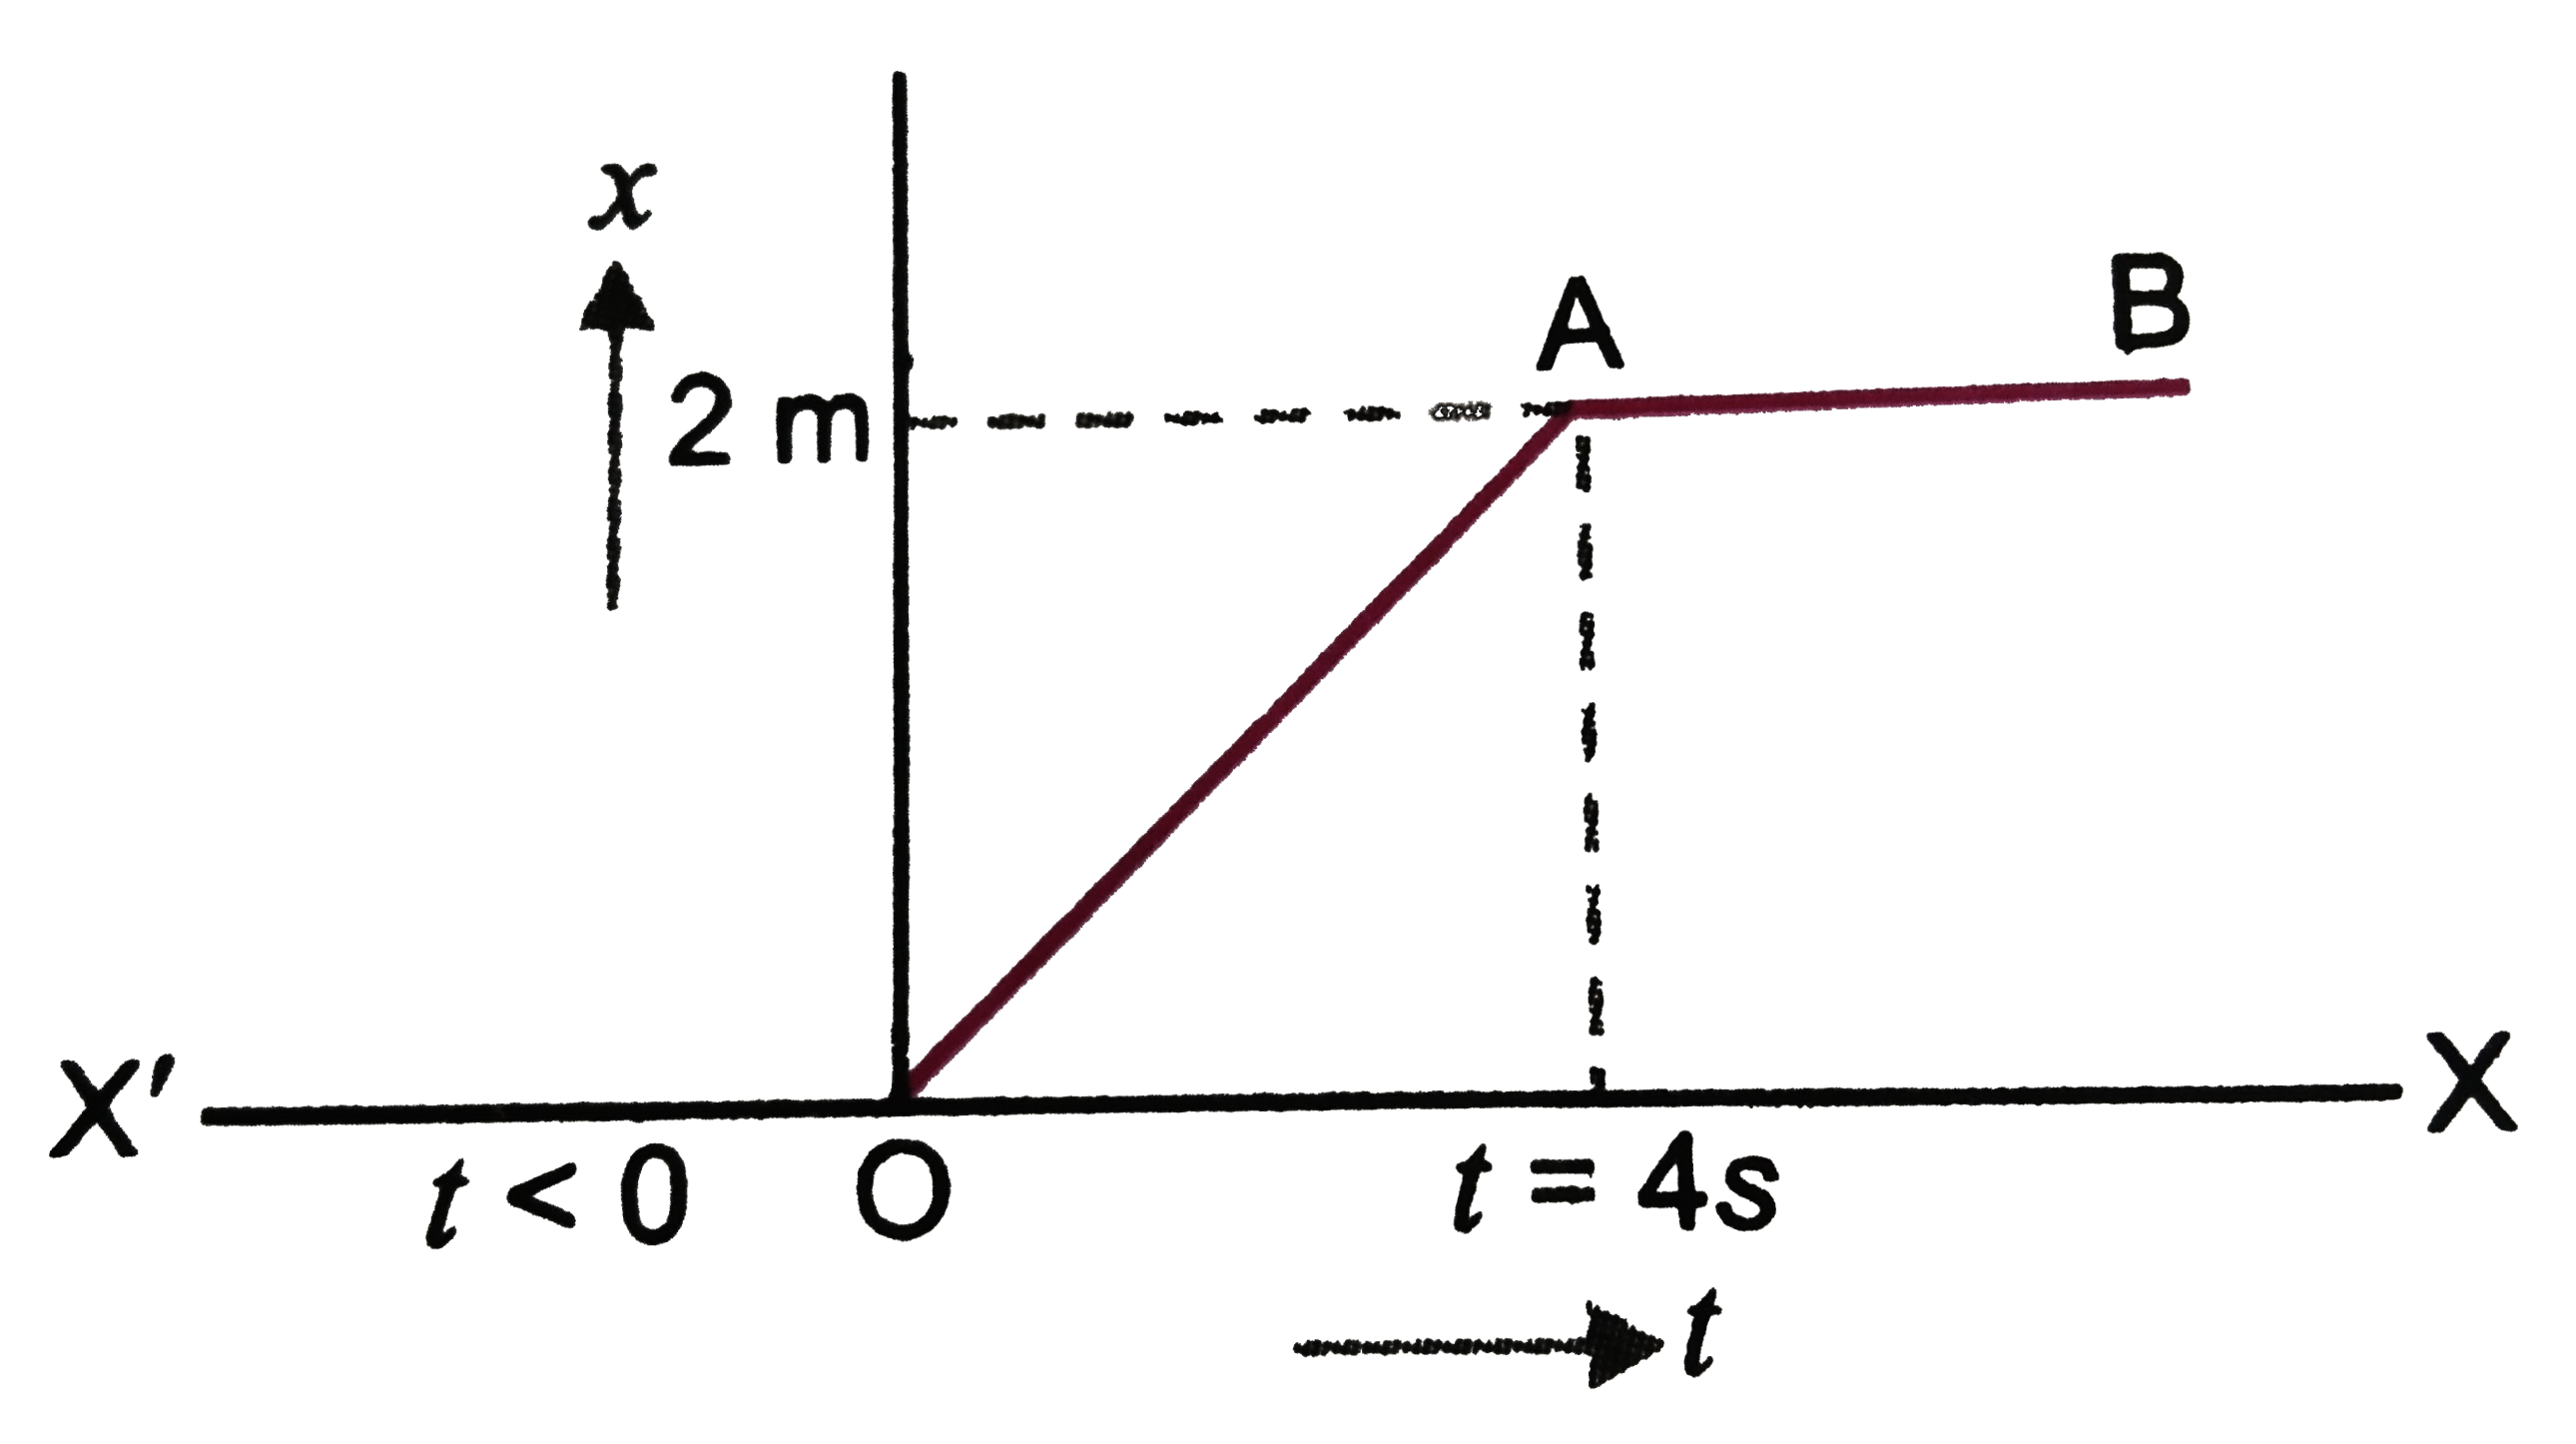
- Fig. shows the position-time graph of a particle of mass 4 kg. What is...
Text Solution
|
- The position-time graph of a body of mass 2 kg is as given in figure ....
Text Solution
|
- Figure shows the position-time graph of a particle of mass 4 kg. What ...
Text Solution
|
- Figure shows the position-time graph of a particle of mass 4 kg. What ...
Text Solution
|
- Figure shows the position-time graph of a particle of mass 4 kg. Wha...
Text Solution
|
- Fig. shows the position-time graph of a particle of mass 4 kg. What is...
Text Solution
|