


Similar Questions
Explore conceptually related problems
Recommended Questions
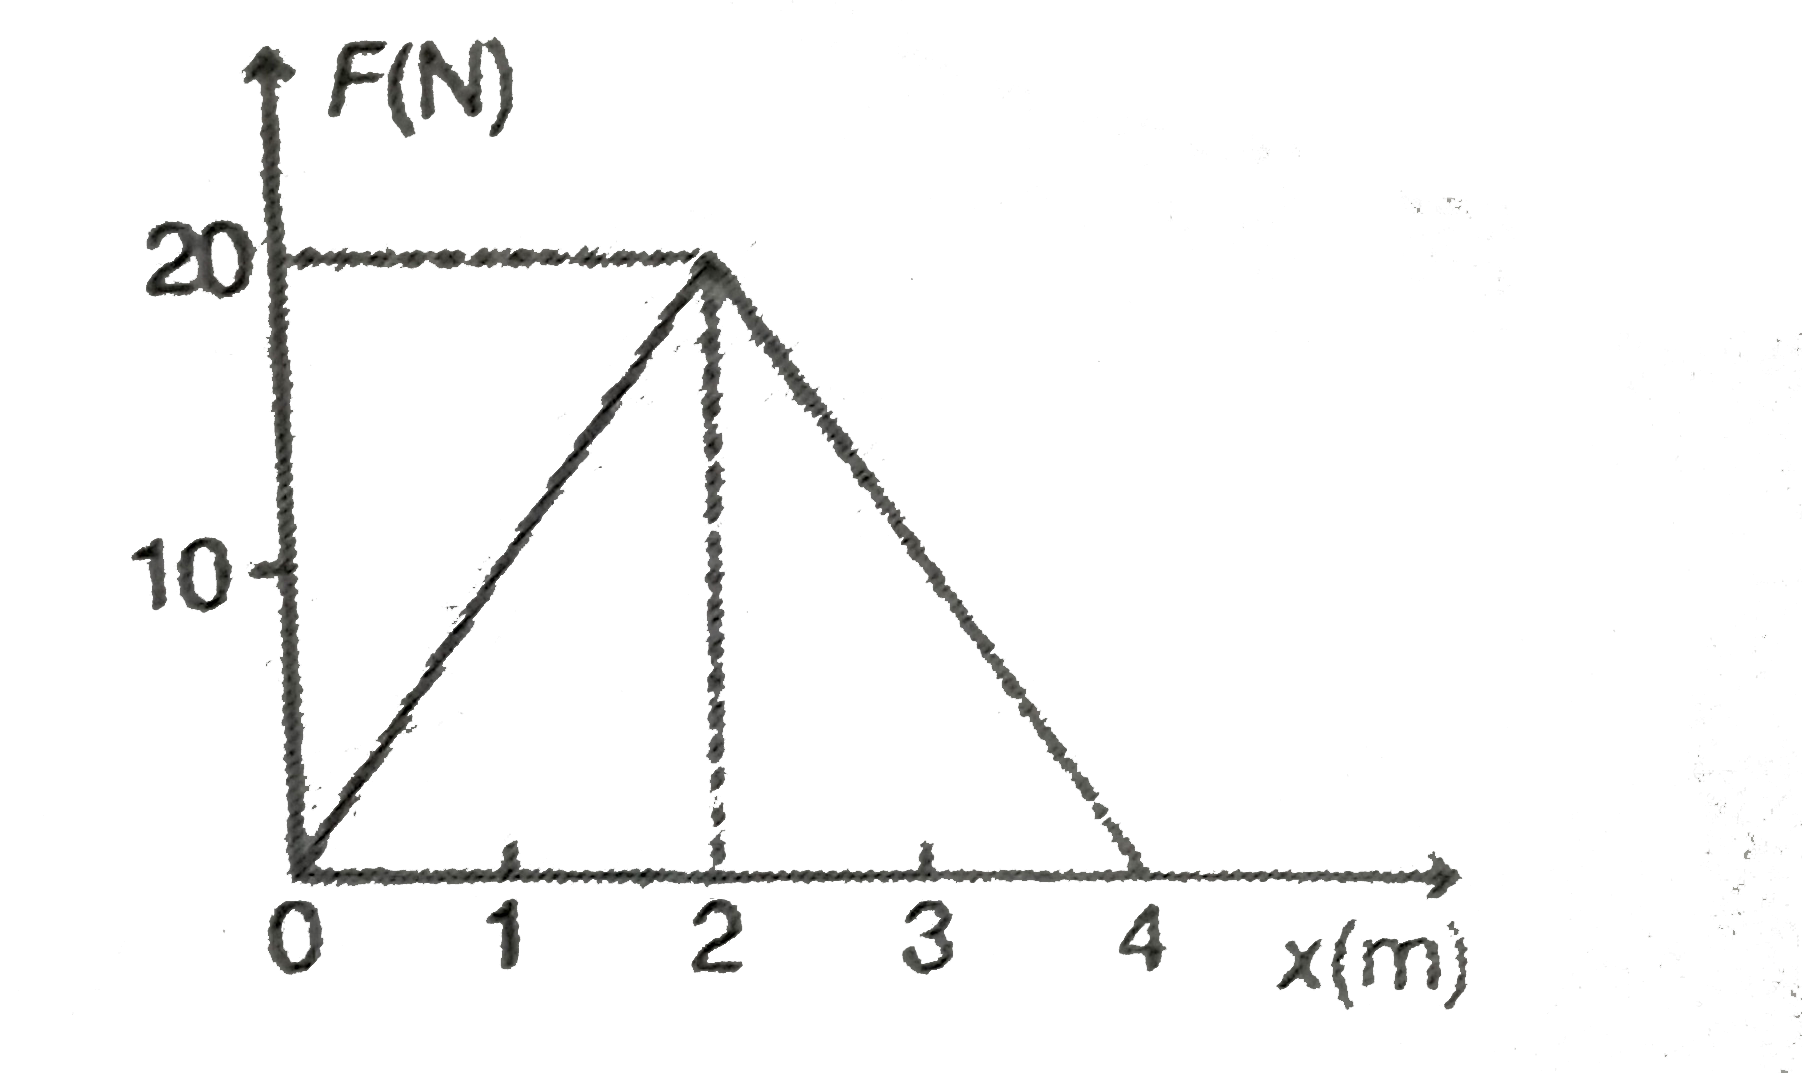
- The graph between the resistance force F acting on a body and the dist...
Text Solution
|
- A body is a acted upon a force which is proportional to the distance c...
Text Solution
|
- The graph between the resistive force F acting on a body and the dista...
Text Solution
|
- A force of 4N acts on a body of mass 2kg for 4s. Assuming the body to ...
Text Solution
|
- A body of mass 5kg is acted upon by a variable force. The force varies...
Text Solution
|
- A body of mass 5 kg is acted upon by a variable force.the force varies...
Text Solution
|
- The graph between the resistance force F acting on a body and the dist...
Text Solution
|
- संलग्न चित्र 7.34 में 1 किग्रा द्रव्यमान के पिण्ड का बल - विस्थापन ग्र...
Text Solution
|
- चित्र में अवरोधी बल और चली गई दूरी के मध्य ग्राफ प्रदर्शित किया गया है...
Text Solution
|