


Similar Questions
Explore conceptually related problems
Recommended Questions
- A graph is plotted between extent of adsorption vs pressure (P) at con...
Text Solution
|
- If a plot a V vs .^(@)C at constant pressure is drawn, at what tempera...
Text Solution
|
- The graph between PV vs P at constant temperature is linear parallel t...
Text Solution
|
- A cusrve showing the variation of extent of adsorption with temperatur...
Text Solution
|
- Plot density vs pressure for a fixed mass of an ideal gas at a constan...
Text Solution
|
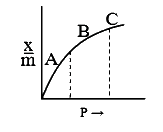
- A graph of x/m vs pressure at constant temperature is called adsorptio...
Text Solution
|
- A graph is plotted between extent of adsorption vs pressure (P) at con...
Text Solution
|
- Pressure vs volume graph at constant temperature is known as…………….
Text Solution
|
- The graph plotted against adsorption versus pressure P at constant tem...
Text Solution
|