Text Solution
Verified by Experts


Topper's Solved these Questions
XII BOARDS
XII BOARDS PREVIOUS YEAR|Exercise Delhi Board : Set II Section-A|1 VideosXII BOARDS
XII BOARDS PREVIOUS YEAR|Exercise DELHI BOARD : SET-III (SECTION -A)|2 VideosXII BOARDS
XII BOARDS PREVIOUS YEAR|Exercise OUTSIDE DELHI: SET III (SECTION A)|2 VideosSAMPLE PAPER 2019
XII BOARDS PREVIOUS YEAR|Exercise Section E Part B|3 Videos
Similar Questions
Explore conceptually related problems
XII BOARDS PREVIOUS YEAR-XII BOARDS-Section -D
- (a) Draw a diagrammatic sketch of a transverse section of an anther o...
Text Solution
|
- (a) Why does DNA replication occur in small replication forks and not...
Text Solution
|
- Write the different components of a lac - operon in E . Coli Explain i...
Text Solution
|
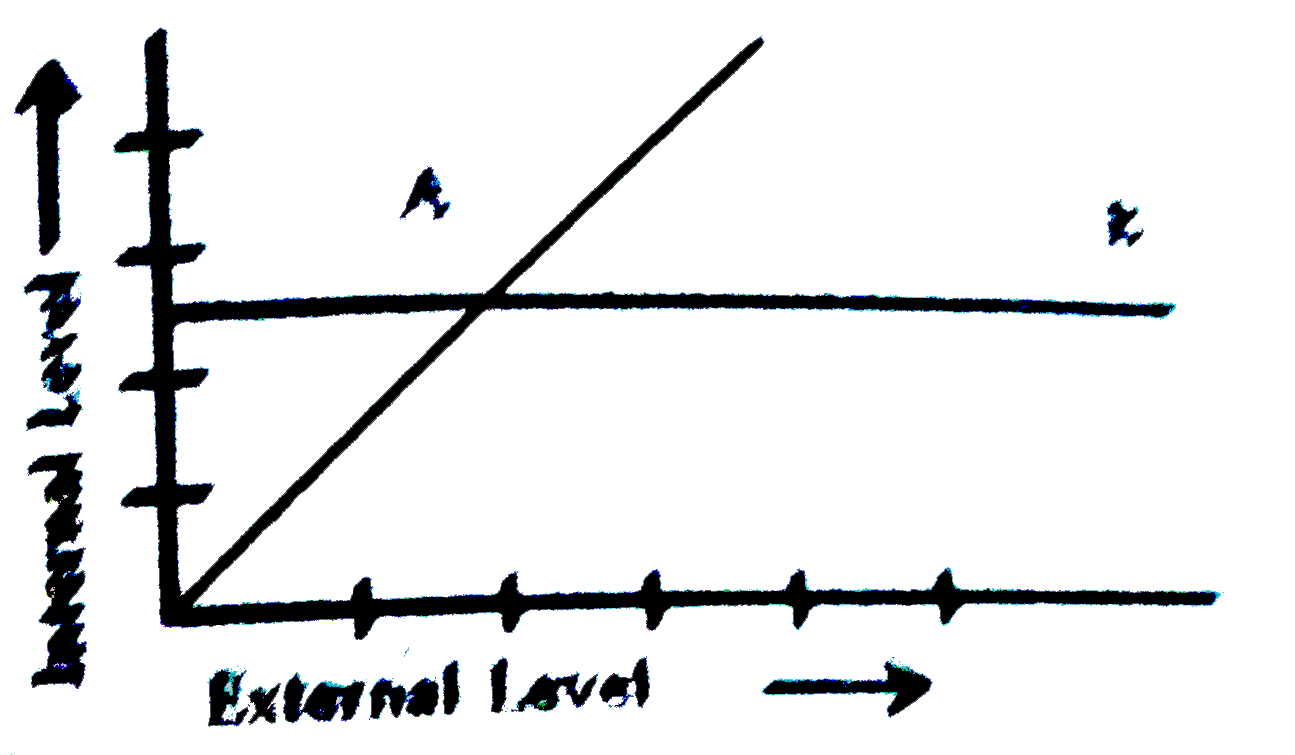
- (a) The graph given below represents the organisms response to temper...
Text Solution
|
- Draw the pyramids of biomass in sea and in a forest. Explain giving re...
Text Solution
|
- Describe the roles of heat , primers and the bacterium <i>Thermus aqua...
Text Solution
|
- Explain the steps involved in the production of genetically engineered...
Text Solution
|
- (a) " Organisms may be conformers or regulators . " Explain this stat...
Text Solution
|
- Describe the onter - relationship between productivity , gross primary...
Text Solution
|
- A national newspaper reported that a 50 metre high 'Sanitary landfill...
Text Solution
|
- (a) Draw a diagram of the adult human female reproductive system and l...
Text Solution
|
- (a) Draw a diagrammmatic sketch of a transverse section of an anther ...
Text Solution
|
- (a) Why does DNA replication occur in small replication forks and not...
Text Solution
|
- What is an operon ? Explain the functioning of lac operon when in an o...
Text Solution
|
- (a) The graph given below represents the organisms response to temper...
Text Solution
|
- Draw the pyramids of biomass in sea and in a forest. Explain giving re...
Text Solution
|
- Describe the roles of heat , primers and the bacterium Thermus aquatic...
Text Solution
|
- Explain the various steps involved in the production of artificial ins...
Text Solution
|
- (a) " Oraganisms may be conformers or regulators . " Explain this sta...
Text Solution
|
- Describe the onter - relationship between productivity , gross primary...
Text Solution
|