Text Solution
Verified by Experts


Topper's Solved these Questions
Similar Questions
Explore conceptually related problems
CBSE MODEL PAPER-SAMPLE QUESTION PAPER (BIOLOGY)-SECTION-C
- A fully developed foetus initiates its delivery from the mother’s womb...
Text Solution
|
- How would you find out the genotype of a pea plant with violet flowers...
Text Solution
|
- Define flocs and state their importance in biological treatment of was...
Text Solution
|
- A farmer noticed that nematode infection in tobacco plants has resulte...
Text Solution
|
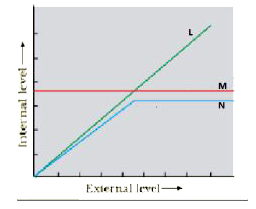
- The graph given below represents three categories of organismic respon...
Text Solution
|
- Give reasons for the following: a. Very small animals are rarely fo...
Text Solution
|