


Similar Questions
Explore conceptually related problems
Recommended Questions
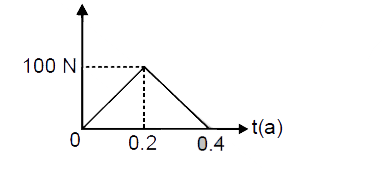
- The figure showns the force versus time graph for a particle. Find t...
Text Solution
|
- A particle of mass 2kg is initially at rest. A force starts acting on ...
Text Solution
|
- A particle starts to move along a straight line. The acceleration vers...
Text Solution
|
- The displacement time graph of a particle executing S.H.M. is as shown...
Text Solution
|
- The displacement time curve of a particle is shown in the figure. The ...
Text Solution
|
- The kinetic energy (KE) versus time graph for a particle moving along ...
Text Solution
|
- A force F acting on a particle varies with the position x as shown in ...
Text Solution
|
- यदि किस कण पर एक नियत बल कार्यरत हो , तो उस कण का विस्थापन - समय ग्रा...
Text Solution
|
- The figure showns the force versus time graph for a particle. Find t...
Text Solution
|