


Similar Questions
Explore conceptually related problems
Recommended Questions
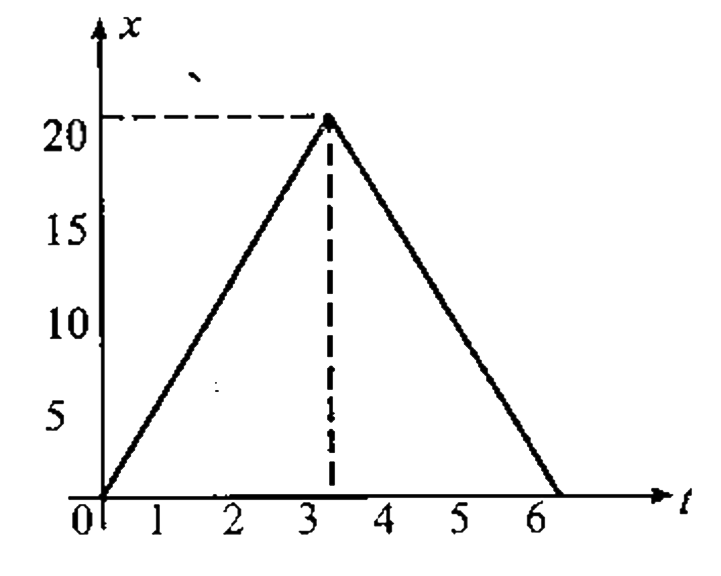
- For the displacement time graph shown in figure -1.100, the ratio of t...
Text Solution
|
- The velocity - time graph of an ascending passenger order lift is give...
Text Solution
|
- For the displacement time graph shown in figure -1.100, the ratio of t...
Text Solution
|
- The velocity - time graph of an ascending passenger order lift is give...
Text Solution
|
- Velocity -time graph for a body of mass 10 kg is shown in figure. Work...
Text Solution
|
- What will be ratio of speed in first two seconds to the speed in next ...
Text Solution
|
- चित्र 3.24 में एक साइकिल सवार का स्थिति - समय ग्राफ दिया गया है । इस ग...
Text Solution
|
- For the displacement-time graph shown in figure, the ratio of the magn...
Text Solution
|
- किसी कण का वेग-समय ग्राफ दर्शाया गया है। प्रथम चार सेकण्ड में तय की गय...
Text Solution
|