


Similar Questions
Explore conceptually related problems
Recommended Questions
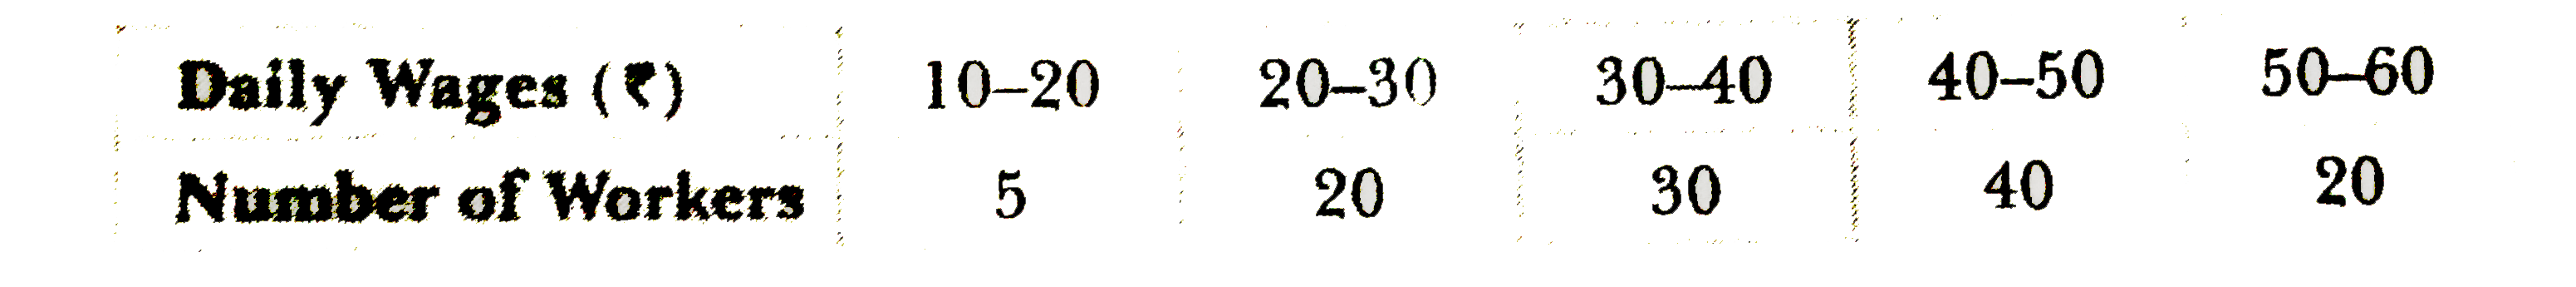
- Represent the following data by frequency curve :
Text Solution
|
- क्लोरोबेंजीन की क्रिया क्यूप्रस ऑक्साइड की उपस्थिति में अमोनिया से करा...
Text Solution
|
- निम्नलिखित में से किसकी अभिक्रिया से फॉस्फोरस से फोस्फीन बनायी जाती है...
Text Solution
|
- जैव-विकास को अवशेषी अंग किस प्रकार परमानित करते है?
Text Solution
|
- विधुत अनुनाद किसे कहते हैं ? श्रेणी अनुनाद परिपथ कि सहयता से अन...
Text Solution
|
- अनुनादी आवृत्ति किसे कहते हैं ?
Text Solution
|
- A .C स्त्रोत की आवृत्ति में परिवर्तन के साथ संधारित्र प्रतिघात ...
Text Solution
|
- प्रत्यावर्ती धारा स्त्रोत की आवृत्ति बदलने पर प्रेरण प्रतिघात त...
Text Solution
|
- 60 माइक्रोफैरड (mu F) धारिता के संधरित्र का 600 हर्ट्ज आवृत्ति पर...
Text Solution
|