Text Solution
Verified by Experts


Topper's Solved these Questions
ELECTROMAGNETIC INDUCTION
MODERN PUBLICATION|Exercise HIGHER ORDER THINKING SKILLS AND ADVANCED LEVEL|8 VideosELECTROMAGNETIC INDUCTION
MODERN PUBLICATION|Exercise REVISION EXERCISE (Very Short Answer Questions Carrying I mark)|44 VideosELECTROMAGNETIC INDUCTION
MODERN PUBLICATION|Exercise NCERT FILE (NCERT EXEMPLAR PROBLEMS SUBJECTIVE QUESTIONS) (Very short answer type questions)|6 VideosELECTRIC CHARGES AND FIELDS
MODERN PUBLICATION|Exercise Chapter Practice Test|15 VideosELECTROMAGNETIC WAVES
MODERN PUBLICATION|Exercise CHAPTER PRACTICE TEST|14 Videos
Similar Questions
Explore conceptually related problems
MODERN PUBLICATION-ELECTROMAGNETIC INDUCTION-NCERT FILE (NCERT EXEMPLAR PROBLEMS SUBJECTIVE QUESTIONS) (Short answer type questions)
- A magnetic field in a certain region is given by B = B(0) cos (omega t...
Text Solution
|
- Consider a closed loop C in a magnetic field (refer to the given figur...
Text Solution
|
- Findthecurrentinthewire fortheconfiguration shown in the figure given ...
Text Solution
|
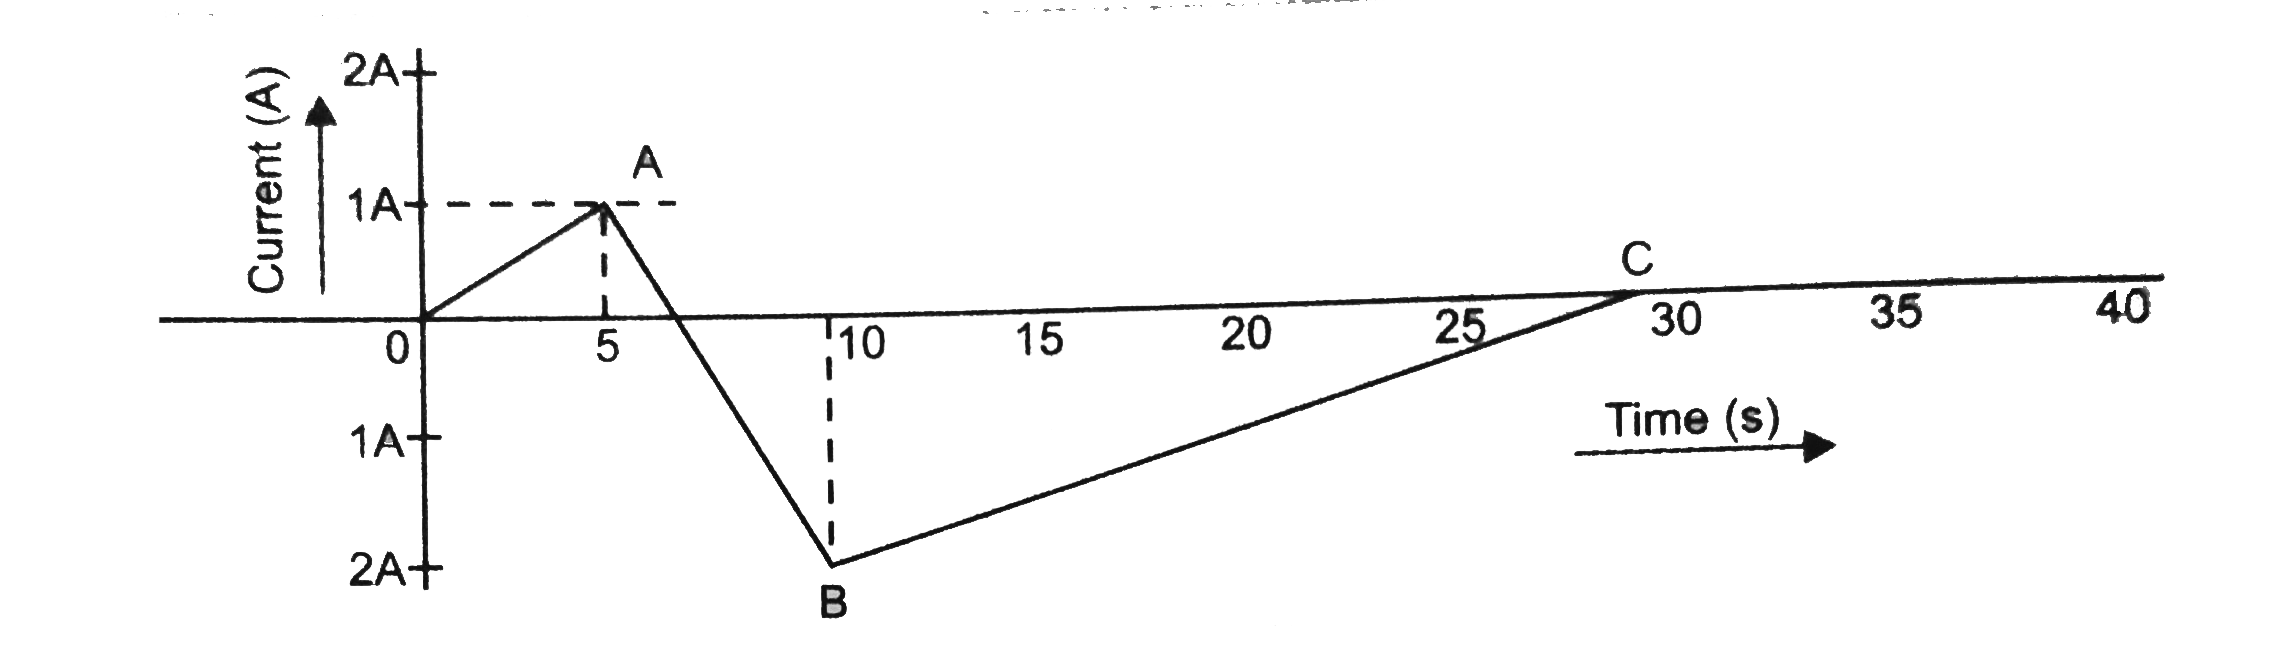
- A (current vs time) graph of the current passing through a solenoid is...
Text Solution
|
- There are two coils A and B separated by some distance. If a current o...
Text Solution
|